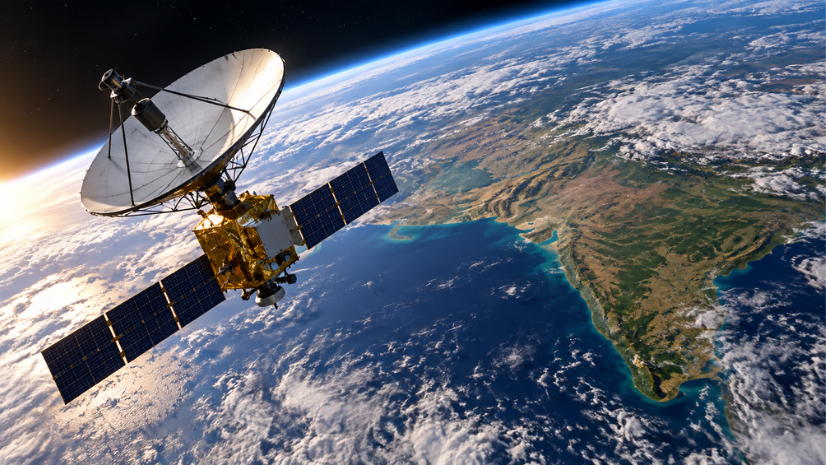
Geographic Information System (GIS) for stubble burning monitoring combines satellite fire detections, crop maps, and village boundaries to show where paddy straw is being burned, when it happened, and which village needs a response. In Punjab and Haryana, where satellite-detected farm fires fell from more than 87,000 in 2020 to under 6,000 in 2025, GIS is how a fire seen from space reaches an officer on the ground.
Introduction: Why Satellites Became India’s Main Witness to Farm Fires
Every autumn, farmers in northwest India have a short window between the paddy harvest and wheat sowing. Punjab alone grew paddy on about 31.54 lakh hectares in 2024, producing an estimated 19.52 million tonnes of straw, according to the Punjab Pollution Control Board.
Burning is the quickest way to clear fields in that window, and the smoke matters far beyond the farm. A Ministry of Earth Sciences release from March 2022 reported that about 20 percent of Delhi’s PM2.5 in October and November came from fire emissions from outside the city, rising to 50 to 75 percent on severe days.
Satellites watch for these fires every day of the season. The CREAMS laboratory at ICAR-IARI recorded 83,002 paddy residue burning events in Punjab in 2020 and 5,114 in 2025, while Haryana fell from 4,202 to 662 over the same period. Behind each count is a mapping process that turns a hot spot on a satellite image into a village name and a field visit.
What Is GIS for Stubble Burning Monitoring?
GIS for stubble burning monitoring means using maps and location data to detect, locate, check and track crop residue fires. It starts with active fire detections from satellite sensors such as VIIRS at 375 m and MODIS at 1 km, which flag spots that are much hotter than their surroundings during each satellite pass. GIS then places these points on a crop map and village boundaries, so each detection becomes a place that someone is responsible for.
Fire points tell only part of the story. Burnt area mapping uses images from satellites such as Sentinel-2 to find blackened fields after a fire, using measures like the Normalized Burn Ratio. ArcGIS Pro can calculate these measures and compare images over time, and ArcGIS Image Server can share the results with field teams and dashboards.
Ready data helps teams start quickly. Indo ArcGIS Living Atlas offers an India view of the global VIIRS fire feed along with India boundaries and a 10 m land use and land cover map for 2025 that includes a crops class.
India’s Monitoring Framework: CAQM, the ISRO Protocol, and CREAMS Bulletins
India uses a standard method to count farm fires. According to a February 2026 Parliament reply by the Ministry of Environment, Forest and Climate Change (MoEFCC), ISRO developed a standard protocol for estimating crop residue burning events from satellite data, together with state remote sensing centers and IARI. Under it, active fire locations are detected during satellite passes, and burnt areas are also assessed.
The CREAMS laboratory at ICAR-IARI publishes daily fire bulletins from 15 September to 30 November for Punjab, Haryana, Delhi, Uttar Pradesh, Rajasthan, and Madhya Pradesh. The bulletins use data from VIIRS on the Suomi NPP satellite and MODIS on the Terra and Aqua satellites. Only fires inside a rice crop map, provided by the Mahalanobis National Crop Forecast Centre (MNCFC) for Punjab and Haryana, and a kharif crop map from NRSC for the other states, are counted. Each bulletin lists fires by district and tehsil or block, with map coordinates and the time of detection.
Enforcement rests with the Commission for Air Quality Management (CAQM) in NCR and Adjoining Areas, and the states. In November 2024, MoEFCC doubled the environmental compensation for stubble burning to ₹5,000 for holdings under 2 acres, ₹10,000 for 2 to 5 acres, and ₹30,000 for more than 5 acres. Alongside penalties, the Crop Residue Management scheme had released ₹4,090.84 crore to states and supported more than 3.45 lakh machines and 43,270 Custom Hiring Centres by November 2025.
How States Turn Fire Points into Field Action
Punjab shows how satellite detection becomes a field task. Its 2024 action plan, filed with the National Green Tribunal, directs fire monitoring through the Punjab Remote Sensing Centre, with SMS alerts sent to field staff. Daily reports carry the latitude, longitude, district, tehsil, block, and village of each fire. A mobile and web app gives role-based logins to officials from village to district level, and nodal officers must visit every fire site within 24 hours.
Haryana uses past satellite data to plan ahead. Before the 2023 season, it grouped villages by their fire history: 147 red zone villages with six or more active fires, 582 yellow zone villages with two to five, and 6,175 green zone villages with one or none. Punjab identified 663 hotspot villages for the 2024 season. In both states, maps decide where machines, awareness drives, and officers go first.
The science behind this monitoring has long links with Esri at IARI, which the institute’s own scientist described as “among some of the oldest user-collaborators of Esri in India.
In a 2020 ArcIndia News interview, Dr. V. K. Sehgal, Professor and Principal Scientist (Agricultural Physics) at IARI, described the role of Esri’s platform in agricultural research:
“Esri’s platform is a valuable aid for precision farming; plant phenomics; developing drought monitoring indices and new models for agricultural crop yield production; monitoring crop residue burning; watershed management; soil mapping, etc.”
Dr. V. K. Sehgal, Professor and Principal Scientist (Agricultural Physics), Indian Agricultural Research Institute.
The ArcGIS Workflow: From Fire Points and Burn Scars to Hotspot Villages
Bringing in Fire Data
VIIRS and MODIS detections arrive as points that update through the day. ArcGIS Living Atlas of the World hosts global fire layers from both sensors and Indo ArcGIS Living Atlas shows the VIIRS feed for India. To track fires as they come in, ArcGIS Velocity can read live feeds and send an alert when new points appear inside a chosen district or block.
Keeping Only Farm Fires
Not every hot spot is a paddy fire, as heat from factories and other sources can also show up. Placing the points on a rice crop map, or on the crops class of the India land use and land cover layer, removes most of these. CREAMS follows the same idea when it counts only fires inside the MNCFC and NRSC crop maps.
Linking Fires to Villages
A spatial join attaches each fire to its village, block, and district, giving field officers the location details they need. ArcGIS Survey123 forms can then record each site visit with photos, what the officer found, and any action taken, so every visit adds checked data.
Mapping Burnt Fields
In ArcGIS Pro, the Normalized Burn Ratio can be calculated from the near-infrared and shortwave infrared bands of Sentinel-2 images using Band Arithmetic. The Change Detection Wizard and Compute Change Raster tools compare images from before and after harvest to outline burnt fields across a district.
Scaling Up with AI
Where burnt fields are many and small, AI capabilities within ArcGIS can be trained on confirmed burnt fields to classify images across whole districts. Field records from earlier visits provide the examples these models learn from.
Finding Villages That Keep Burning
The Create Space Time Cube and Emerging Hot Spot Analysis tools show which villages have new, rising or repeated burning across several seasons. This gives planners a ranked list for sending machines and planning outreach before the next harvest.
Reporting Progress
ArcGIS Dashboards can show daily fire counts, district trends, field check status, and penalties on one screen for district and state officials. State agriculture and environment departments planning crop residue monitoring can explore Agriculture solutions from Esri India.
Fire Counts vs Burnt Area: Why Evening Burning Changes the Picture
Fire counts and burnt area answer different questions. NASA Earth Observatory reported in December 2025 that most stubble fires in northwest India used to be lit between 1 p.m. and 2 p.m., but now mostly happen between 4 p.m. and 6 p.m. It cited an ISRO study showing peak fire activity moving from about 1:30 p.m. in 2020 to about 5:00 p.m. in 2024. Since the VIIRS sensor on Suomi NPP passes over around 1:30 p.m., fires lit later in the day can burn out between passes.
| Aspect | Active Fire Counts | Burnt Area Mapping |
| What it shows | Heat from a fire burning during a satellite pass | Blackened fields left after burning |
| Main sensors | VIIRS (375 m), MODIS (1 km) | Images such as Sentinel-2 (10 m) |
| Timing | Within hours of a satellite pass | After the event, once a clear image is available |
| Main limit | Can miss fires lit between passes or under cloud | Takes longer and needs cloud-free images |
| Best use | Daily alerts and field checks | Seasonal extent and trends |
The practical answer is to use both. Daily fire points guide the field response, while burnt area maps give a fuller measure of how much land burned over the season. NRSC took this approach for the 2023 kharif season, pairing Sentinel-2 burnt area mapping at 10 m with VIIRS active fire data. Satellites that stay over one region add frequency: NASA tracked the timing shift using the South Korean GEO-KOMPSAT-2A satellite, which takes images every 10 minutes.
Challenges and the Road Ahead
Gaps Between Satellite Passes
Satellites like Suomi NPP see each place only a few times a day, so fires lit in the late afternoon or evening can be missed. Burnt area maps and frequent images from satellites that stay over one region help close this gap, but they are either coarser or come later.
Cloud and Smoke
CREAMS noted that clouds hampered fire detection over parts of eastern Madhya Pradesh, eastern and northern Uttar Pradesh, and Uttarakhand early in the 2026 season. Cloud and haze also block the clear images needed for burnt area mapping, which can delay the full seasonal picture.
A Wider Area to Watch
As counts fell in Punjab and Haryana, CREAMS recorded 17,067 events in Madhya Pradesh and 7,290 across Uttar Pradesh in 2025. Crop maps, village data, and field networks built for two states now need to cover a much wider region.
Field Checks at Scale
Visiting every fire site within 24 hours is a large task across hundreds of hotspot villages. Mobile forms, clear village assignments, and dashboards that show which sites are still unchecked can help field teams keep up during the peak weeks of the season.
The view from space has changed how India manages farm fires: a heat signal picked up at 375 m can become a village alert, a field visit, and an entry in a seasonal record. As burning shifts to later hours and new districts, combining fire points, burnt area maps, and field records on one map will help states match their response to where fields actually burned.
FAQs
1.How is stubble burning monitored in India?
Stubble burning is monitored mainly through satellites. The CREAMS laboratory at ICAR-IARI detects paddy residue fires using a standard ISRO method and publishes daily bulletins from 15 September to 30 November. States use these fire locations to send field officers to check and act.
2.Which satellites are used to detect farm fires in India?
CREAMS bulletins use the VIIRS sensor on Suomi NPP at 375 m and the MODIS sensors on Terra and Aqua at 1 km. Satellites such as Sentinel-2 are used to map burnt fields, and satellites that stay over one region help study burning at different times of day.
3.Why might satellite fire counts miss some stubble fires?
Satellites such as Suomi NPP pass over each place only a few times a day, so fires lit between passes may not be recorded. NASA and an ISRO study report that burning has shifted to the late afternoon, after the main daytime pass. Clouds can also block detection.
4.How does GIS help reduce stubble burning?
GIS links each fire to a village and an officer, so field teams can respond quickly. It also ranks villages by burning history, helping states send machines, decomposer kits, and conduct awareness drives where they are needed most.
5.What is the penalty for stubble burning in India?
Under rules notified in November 2024, environmental compensation for stubble burning is ₹5,000 for holdings under 2 acres, ₹10,000 for 2 to 5 acres, and ₹30,000 for holdings above 5 acres. Nodal and supervisory officers in each state are authorized to collect it.
Written by
Esri India Marketing