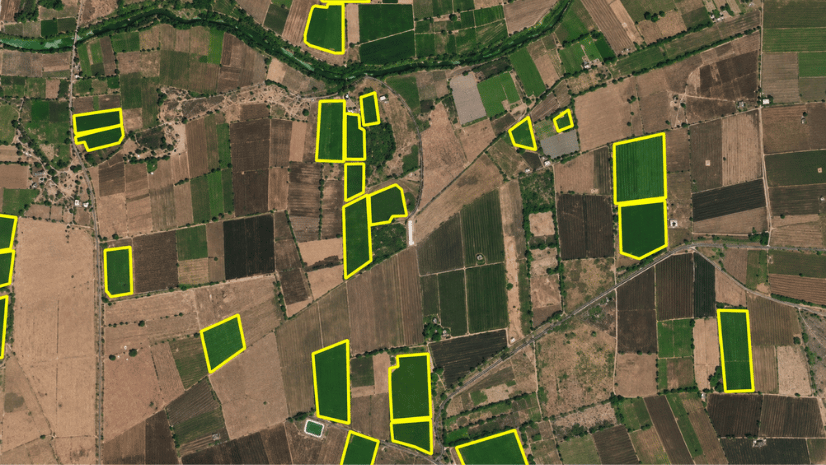
GIS has always helped us understand where things are. But understanding what is happening at a location often depends on supporting information such as photographs, inspection notes, reports or other descriptive contents. While this information adds valuable context, it is typically unstructured, making it more difficult to interpret and use consistently.
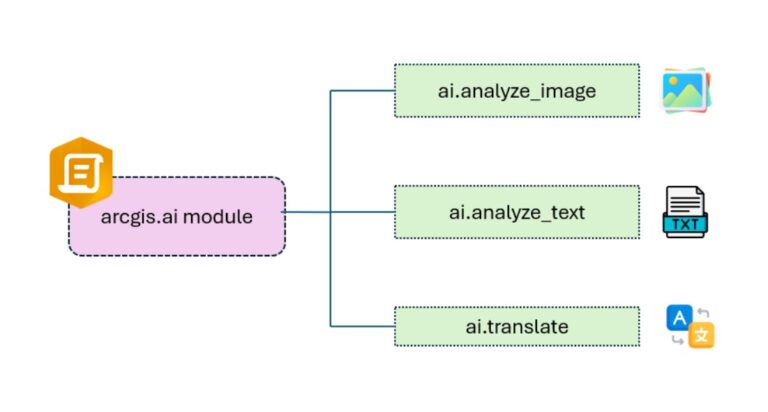
The ArcGIS API for Python extends these possibilities through its arcgis.ai module, bringing AI-powered services into Python-based geospatial workflows. This module provides built-in methods for bringing AI directly into your GIS workflows through natural language prompts.
The module has three methods.
- analyze_text: Analyze or transform text with natural language prompts.
- analyze_image: For understanding and extracting information from images.
- translate: Translate text into one or more languages.
Seeing It in Action: Utility Asset Inspection
To see how the AI module works in practice, let’s look at how it can be used to inspect electric poles within a utility network.
Electric poles are exposed to unpredictable weather, age and occasional accidents, all of which can affect their condition. Identifying which ones need repair still depends on a physical visit. Field workers carry out this inspection, capturing each pole and recording a note on its condition.
The problem starts after that. The photo and the note both hold useful information. But someone still has to open every photo, decide if the pole is damaged, and rate how serious it is. With a few hundred poles, that takes days. This is where the AI module can step in to automate that process.
The arcgis.ai module Powered Approach
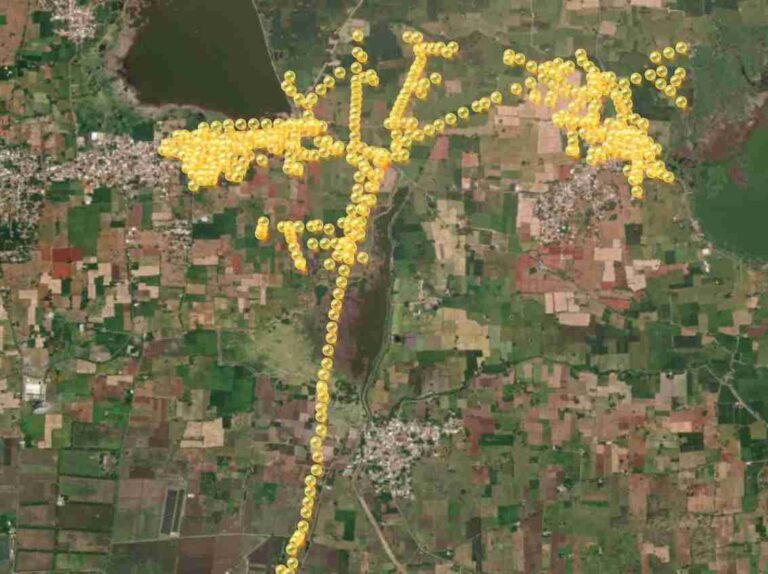
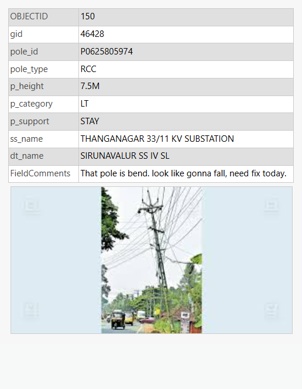
Electric pole inspections are carried out using ArcGIS Survey123 Mobile. At each pole, the field worker records the location, takes a photo and types a comment. This data goes into a feature layer, where each pole has its own record, and the photo is attached directly to it.
Once the field inspection is completed, the next challenge is analyzing it efficiently. Instead of manually reviewing every image and comment, we can integrate the arcgis.ai module that automatically detects issues, generates observations, and updates the inspection results.
Let’s see how the entire inspection process can be automated using the AI module
Step 1: Analyzing Image Attachments
Each pole record already has a photo attached to it. But a photo alone doesn’t tell us what asset is in the image, whether it’s damaged, or how serious the issue is. Those details need to be extracted from the image before they can be used for analysis.
This is what analyze_image in ai module does. It takes the attached image along with a set of prompts and returns the answers as structured fields that can be stored with the inspection record.
We wanted to capture four key details from every inspection photo: type of asset, a brief description of its condition, whether the asset is damaged, and its risk level.
Each prompt instructs the model to extract one of the required inspection attributes from the image:
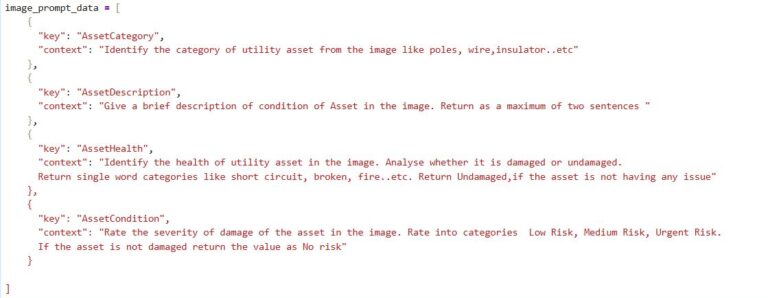
After the analysis is complete, each pole record now contains additional fields such as the asset category, a short description, its health and the risk level. Since these are stored as attributes, they can be searched, filtered, and visualized just like any other field.
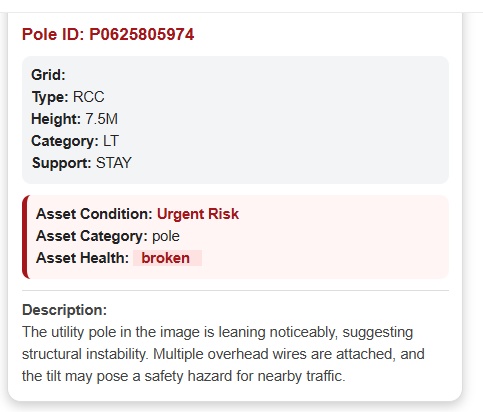
At this point, the inspection records contain much more than just photos and comments. The image is no longer just an attachment—it now contains structured information that can power decision-making dashboards.
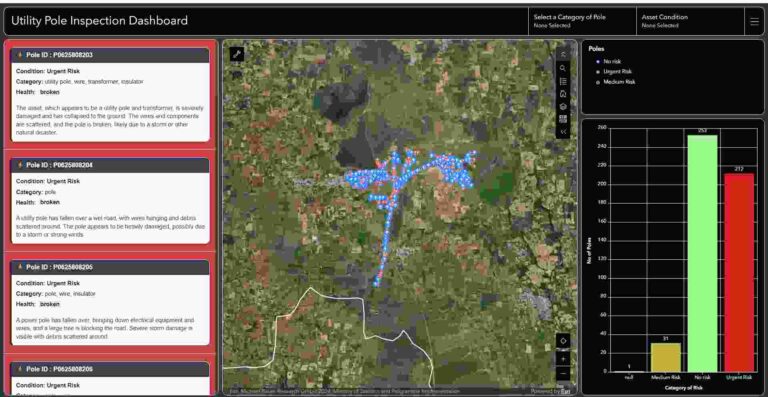
Let’s take a closer look at one of the poles identified as Urgent Risk.
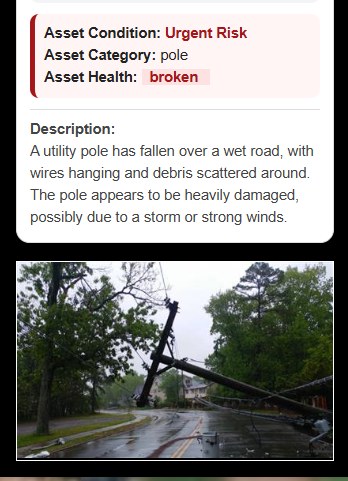
From the image attachment, analyze_image method identified the pole in the image. It also detected that the pole is broken, classified the risk as urgent and even provided a short description explaining that the pole appears to have been damaged by a storm or strong winds.
Instead of simply labeling the image as “damaged,” the model provides useful context that helps inspectors understand what has happened in the field.
Step 2: Converting Field Comments into Clear Summaries
Images are only one part of an inspection. Field inspectors also write comments describing what they observed on site. These notes are valuable, but they’re often written quickly, contain spelling mistakes, incomplete sentences or inconsistent phrases.
The arcgis.ai module can help here too. Using analyze_text method, we can automatically correct spelling and grammatical errors which generate a clean summary of each field comment.
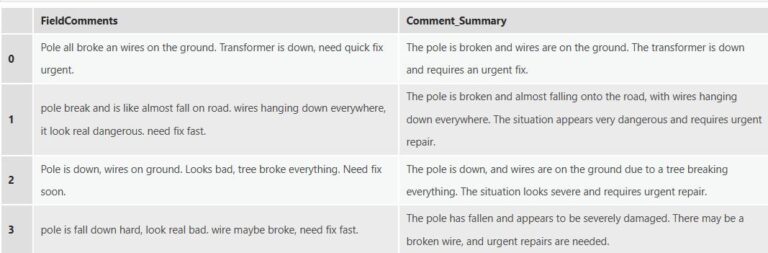
The difference is easy to see. The original comments are short, inconsistent, and contain spelling and grammatical errors. After running analyze_text, each comment is rewritten into a clear, readable summary while preserving the original meaning. The cleaned summaries make inspection records much easier to read and ensure that everyone is working with consistent information.
Field inspections generate large amounts of unstructured information in the form of images and free-text comments. While this information is valuable, reviewing it manually takes time and makes it harder to identify patterns, prioritize work, and make timely decisions.
With the arcgis.ai module in ArcGIS API for Python, these tasks can be automated as part of your existing workflows. Image analysis, text analysis, and translation method can be used to extract meaningful information from unstructured data, reducing manual effort and enriching your GIS data with insights that are ready to use.
The utility inspection example shows one way this capability can be used. Similar challenges exist across many GIS workflows where images and text need to be reviewed before they become useful. This can be applied to many other repetitive tasks such as analyzing road inspections, summarizing field reports or even translating multilingual content.

Sreebhadra is a Analyst and works on translating GeoAI capabilities into practical ArcGIS solutions.