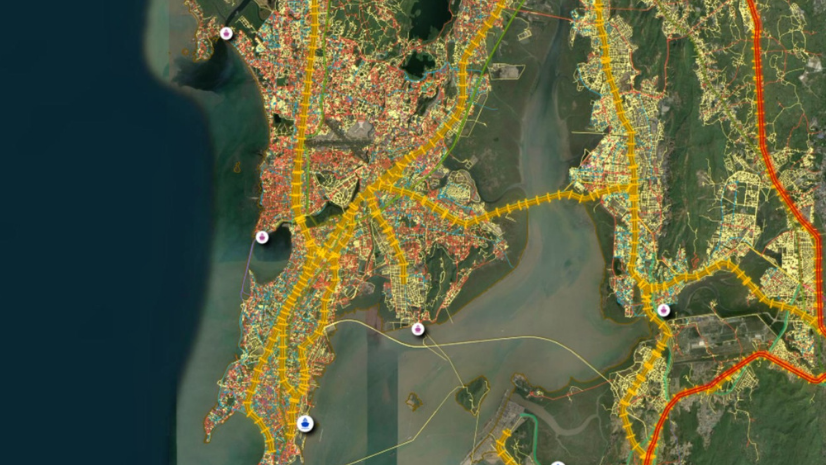
GIS for cyclone disaster management uses Geographic Information System (GIS) technology to map where a cyclone’s wind, rain, and storm surge are likely to strike, who lives in their path, and how people can reach safety in time. With India’s coastline now measured at 11,098.81 km, these maps help authorities decide which villages to evacuate, which shelters to open, and which roads to keep clear before landfall.
Introduction: Why Every Cyclone Season Tests India’s Coastal Preparedness
Every year, the post-monsoon months of October to December bring a fresh round of cyclone risk to India’s coasts. In December 2025, the government released a revised coastline length of 11,098.81 km and noted that the updated figure helps governments prepare more effectively for cyclones. Along that coast sit towns, villages, farms, ports, and fishing communities that may need to move at short notice.
Forecasts have become much sharper. According to a Ministry of Earth Sciences (MoES) reply in Parliament, landfall and intensity forecast accuracy improved by 35 to 45 percent in 2021-2025 compared with 2016-2020, and Cyclones Biparjoy (2023) and Dana (2024) recorded zero deaths. The harder task is turning a forecast into action on the ground: who should move, where they should go, and which road they should take.
| Aspect | Warning-Led Response | Map-Led Cyclone Planning |
| Deciding who evacuates | Broad orders based on the forecast track | Villages ranked by surge, wind, and rainfall exposure |
| Choosing shelters | The nearest known building | Shelters matched to the people who can reach them in time |
| Planning routes | The usual roads | Routes that avoid low-lying roads and bridges likely to flood first |
| Tracking progress | Phone calls and paper reports | Field updates on one shared map |
| After landfall | Damage surveys that start from scratch | Damage reported against the same exposure map |
What Is GIS for Cyclone Disaster Management?
GIS for cyclone disaster management brings layers such as the cyclone track, storm surge, rainfall, elevation, population, roads, and shelters onto one map. Planners can then see where the hazard and the people overlap. This turns a forecast into a clear list of places that need action.
The same map supports every stage of a cyclone. Before the season, it helps with risk mapping and shelter planning. In the days before landfall, it guides evacuation, and after the storm, it supports damage assessment and relief.
ArcGIS Pro can be used to build exposure and storm surge analysis on the desktop. ArcGIS Online can then share those maps with departments and district teams through a web browser.
India’s Cyclone Risk Framework: IMD, NDMA, NCRMP, and State Disaster Management Authorities
The India Meteorological Department (IMD) forecasts cyclones and issues warnings. On 12 October 2026, IMD launched an interactive WebGIS-based Cyclone Warning and Marine Weather Services Decision Support System, available on the IMD and Regional Specialised Meteorological Centre (RSMC) New Delhi websites. It shows cyclone tracks, intensity, the cone of uncertainty, winds, rainfall, storm surge, and district-wise rainfall warnings. The Indian National Centre for Ocean Information Services (INCOIS) adds storm surge alerts and ocean state advisories.
The National Disaster Management Authority (NDMA) has developed a web-based Dynamic Composite Risk Atlas and Decision Support System (Web-DCRA) for cyclone risk mitigation and response planning. It was used during Cyclone Biparjoy in June 2023 and Cyclone Michaung in December 2023. Under the National Cyclone Risk Mitigation Project (NCRMP), 68,988 community representatives have been trained in first aid, search and rescue, and shelter management through 3,421 Shelter Level Trainings.
NCRMP was carried out in eight coastal states in two phases. The first phase, for Andhra Pradesh and Odisha, was approved in January 2011 and completed in December 2018. The second phase, for Goa, Gujarat, Karnataka, Kerala, Maharashtra, and West Bengal, was approved in July 2015 and completed in March 2023. Its components included early warning dissemination, multipurpose cyclone shelters, evacuation roads and bridges, saline embankments, and underground cabling, with spending of ₹2,524.84 crore in the first phase and ₹1,806.84 crore in the second.
Warnings come from national agencies, but action happens in State Disaster Management Authorities (SDMAs) and district control rooms. A shared map lets each of them work from the same picture of the hazard, the people at risk, and the resources available. National Government and State and Local Government agencies can use this kind of common platform to plan together before a cyclone arrives.
How GIS Maps Storm Surge and Coastal Exposure
Storm surge is often the deadliest part of a cyclone, so exposure mapping usually starts at the shoreline and works inland.
Storm Surge Zones
Storm surge is the rise in sea level pushed ashore by a cyclone’s strong winds and low pressure. Planners combine surge forecasts with coastal elevation and distance from the shore to mark land that is likely to flood. Low-lying areas near river mouths and creeks usually need attention first, because surge water travels furthest there.
Coastal Elevation and Imagery
Elevation data shows which land sits only a few meters above sea level. ArcGIS Image Server can manage and analyze elevation models and satellite imagery, so surge zones can be checked against the actual shape of the coast.
People and Assets at Risk
Indo ArcGIS Living Atlas provides ready-to-use India layers such as village and district boundaries, demographics, and population projections. Placing these over surge zones shows how many people live in each zone and which schools, hospitals, and markets lie inside it.
Wind and Rain Exposure
Surge is not the only threat. Strong winds can damage weak houses well inland, and heavy rain can flood rivers and cut roads far from the coast, so wind and rainfall forecasts form their own layers.
Ranking Villages
When surge, wind, rain, and population layers are combined, each village can be given an exposure score. This helps a district decide which villages to evacuate first when time is short.
Shelters and Evacuation Routes: Siting, Service Areas, and Route Planning
An evacuation plan works only if every exposed village has a safe place to go and a safe way to get there.
Siting Shelters
Multipurpose cyclone shelters, built under NCRMP alongside evacuation roads and bridges, can be used as schools or community halls in normal times and as refuges during cyclones. GIS can check whether each shelter sits outside surge zones and on higher ground. It can also show where new shelters would serve the most people.
Shelter Service Areas
A service area shows how far people can travel along the road network in a set time. ArcGIS Network Analyst can draw these areas around each shelter for walking or driving. Villages that fall outside every service area show where the gaps lie before a cyclone arrives.
Matching People to Shelters
Comparing the population inside each service area with the shelter’s capacity shows which shelters may fill up first. Planners can then assign villages to other shelters or arrange transport in advance.
Planning Evacuation Routes
The shortest road is not always the safest one. Routes can be planned to avoid low-lying roads, bridges, and causeways that are likely to flood first, so people are not caught by rising water on the way to safety.
Updating From the Field
Conditions change quickly as a cyclone approaches. ArcGIS Survey123 lets field teams report shelter occupancy, blocked roads, and damage with photos and locations, so the plan reflects what is happening on the ground.
Inside the Cyclone Control Room: Dashboards, Warnings, and Live Monitoring
In the hours before landfall, a district control room has to follow many moving parts at once. ArcGIS Dashboards can bring the latest warning, the forecast track, shelter status, road conditions, and field reports into one screen. Officers can then see where people have moved, which shelters are filling, and which roads are closed.
Sharper forecasts give control rooms a narrower area to act on. During Cyclone Ditwah in November 2025, IMD’s track forecast errors were 49, 62, 60, and 100 km at 24, 48, 72, and 96 hours, against 2020-24 averages of 72, 111, 154, and 183 km. A smaller error means a tighter cone of uncertainty, so evacuation zones on the map can be narrowed with more confidence as landfall nears. Esri India has also built a public monitoring application during a cyclone.
In October 2024, it released the Dana Cyclone Monitoring Application, developed using Esri’s configurable dashboards, to give authorities and the public critical insights about the movement of Cyclone Dana. Disaster management teams can explore Emergency Management solutions from Esri India to plan similar control-room views for their own districts.
Challenges and the Road Ahead
Last-Mile Connectivity
Power and mobile networks often fail close to landfall, just when field updates matter most. A control room that depends on live reports can lose sight of shelters and roads in the very hours it needs them. Field apps that collect data offline and sync once a signal returns can help, but teams still need a fallback such as satellite phones or fixed reporting times by radio. Warnings face the same risk, which is why India’s Common Alerting Protocol (CAP) based alert system sends geo-targeted alerts through several channels, including SMS, TV, radio, coastal sirens, and cell broadcast.
Shelter Data That Goes Out of Date
A shelter’s condition, capacity, and access road can change between seasons. A roof may need repair, a generator may not work, or the approach road may have been damaged in the last monsoon. If the shelter list is not checked before each season, people may be sent to a building that cannot take them. A short pre-season survey of every shelter, with photos and locations recorded on the map, keeps the list close to what is on the ground.
Coordination Across Agencies
IMD, INCOIS, SDMAs, district control rooms, and line departments such as roads, power, and health each hold part of the picture. When each agency keeps its data in its own format, the control room spends precious hours matching lists instead of acting on them. A shared map works only when each agency updates its own layer on time and uses the same village names and boundaries. Agreeing on these basics before the season, and testing them in pre-cyclone drills, saves time when a real storm arrives.
Time to Open Shelters
Even with an early warning, a district has limited hours to staff shelters, stock food and water, and move people. Elderly residents, people with disabilities, and families with young children need more time and help to move. Plans need to reflect how many shelters can realistically open, and how many people can be moved, before winds and water close the roads.
Mapping these vulnerable households in advance lets a district start with the people who need the most time. India has made real progress in cutting cyclone deaths, and better forecasts are a big part of that story. The next gains will come from acting faster at village level, with each district knowing which homes face surge, which shelter each family should reach, and which road will still be open. When those answers sit on one map before the season begins, every warning can turn into safe evacuation more quickly.
FAQs
1.How is GIS used in cyclone disaster management?
GIS combines cyclone forecasts with maps of storm surge, elevation, population, roads, and shelters to show who is at risk and where they can go. Authorities use it to plan evacuations, track shelters, and assess damage after landfall.
2.What is the National Cyclone Risk Mitigation Project (NCRMP)?
NCRMP is a national project that strengthened cyclone preparedness in eight coastal states across two phases. It included early warning systems, multipurpose cyclone shelters, evacuation roads and bridges, saline embankments, and underground cabling.
3.How are storm surges forecast and mapped in India?
IMD shows storm surge warnings on its WebGIS decision support system, and INCOIS issues storm surge alerts. Mapping these forecasts against coastal elevation shows which land is likely to flood.
4.What is a multipurpose cyclone shelter?
It is a building that can serve the community in normal times, for example as a school or hall, and becomes a safe refuge during cyclones. These shelters were built in coastal states under NCRMP.
5.How does GIS help plan evacuation routes during a cyclone?
GIS maps the road network against surge and flood zones, so planners can choose routes that avoid roads and bridges likely to flood first. It also shows how long people would take to reach the nearest shelter.
Written by
Esri India Marketing