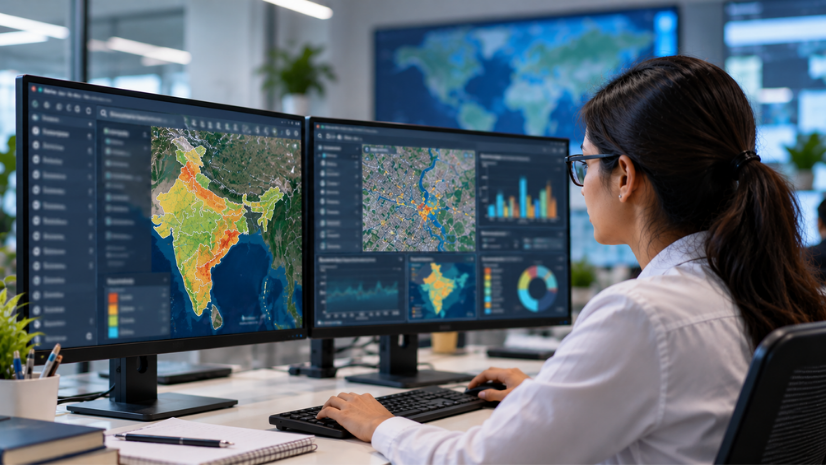
GIS for river basin monitoring uses Geographic Information System (GIS) technology to bring together sensor readings, satellite imagery, and field observations from across an entire river system into a single spatial view. For the Ganga, India’s largest and most closely watched river, that shift from scattered manual sampling to a live, integrated basin picture has changed what river governance actually looks like.
Introduction: From Manual Sampling to Real-Time Basin Governance
For decades, understanding the health of a river as vast as the Ganga meant collecting water samples by hand at fixed points and waiting weeks for lab results. By the time a pollution spike showed up in a report, the water carrying it had long since moved downstream. Over a main stem stretching more than 2,500 kilometers through five states, that lag between event and evidence made proactive river management nearly impossible.
Real-time monitoring changes the timeline entirely. Instead of a snapshot taken once a month at a handful of stations, an integrated spatial platform can pull in continuous sensor readings, satellite imagery, and field reports the moment they’re generated, giving river managers a live, rather than retrospective, view of the Ganga’s condition.
| Aspect | Manual Sampling | Real-Time GIS Monitoring |
| Data collection | Fixed stations, periodic field visits | Continuous sensor feeds, satellite imagery, field apps |
| Time to insight | Days to weeks for lab results | Near-instant, as readings arrive |
| Spatial coverage | Isolated station points | Basin-wide, interpolated between stations |
| Response to events | After the fact, once a report is compiled | As conditions change, via live dashboards |
| Coordination | Separate reports per agency | Shared spatial view across agencies |
What Is Real-Time GIS for River Basin Monitoring?
Real-time GIS for river basin monitoring is the practice of linking live sensor networks, satellite feeds, and field data collection tools to a shared spatial platform, so that every reading is mapped to its exact location the moment it arrives. Instead of a spreadsheet full of station codes and dates, managers see a map that updates as conditions change.
This spatial framing matters because rivers don’t behave like isolated data points. A pollution event upstream affects water quality for hundreds of kilometers downstream, and understanding that relationship requires seeing the whole basin at once, not comparing disconnected station reports after the fact. A GIS-based platform makes that network-wide view the default way of working rather than something reconstructed after a problem has already occurred.
India’s River Basin Architecture: NMCG, CPCB, and the State Ganga Committees
The Ganga’s monitoring and governance framework runs through several layered institutions. The Namami Gange program was launched in 2014-15 and approved as a Central Sector Scheme in 2015 to integrate pollution abatement, ecological flow, biodiversity, and public engagement efforts under one basin-wide approach. To give this effort institutional teeth, the National Mission for Clean Ganga (NMCG) was notified as an Authority under the Environment (Protection) Act, 1986 on 7 October 2016, granting it regulatory and administrative powers under the Ministry of Jal Shakti.
Oversight doesn’t stop at the national level. The Central Pollution Control Board (CPCB) provides water quality assessment and pollution classification data for river stretches nationally, while State Ganga Committees, including bodies like the Uttar Pradesh SMCG and West Bengal SPMG, coordinate implementation within their states. At the most local level, 139 District Ganga Committees hold monthly review meetings under a “4M” framework, Monthly, Mandated, Minuted, and Monitored, with more than 4,377 such meetings recorded as of July 2025.
This layered structure is precisely why a shared spatial platform matters. When national, state, and district bodies are all working from the same map rather than separate reports, coordination stops depending on someone manually reconciling conflicting data.
How GIS Assembles the Basin-Wide Operational Picture
A basin-scale GIS platform is built by layering several distinct capabilities on top of one another, and it’s worth being precise about which of these NMCG has actually deployed versus what the underlying technology generally enables. Broadly, these capabilities fall into a few groups: bringing data together, enabling teams to collaborate on it, collecting it from the field, streaming it in real time, and adding satellite context on top.
Consolidating diverse data sources
ArcGIS provides the core visualization and mapping layer that NMCG uses to bring together water quality readings, project status, and geospatial records in one place. Beyond what NMCG has documented, a platform like ArcGIS Enterprise can extend this kind of consolidation to an organization’s own on-premise infrastructure for basins where data sovereignty is a priority.
Enabling cloud-based collaboration
ArcGIS Online supports the collaboration layer NMCG uses to share maps, data, and analyses among stakeholders, letting agencies like state pollution boards and district offices work from the same live information rather than emailing spreadsheets back and forth.
Collecting data from the field
NMCG’s field teams use ArcGIS mobile applications to collect and update data in the field, streamlining water quality and biodiversity monitoring. For basins looking to formalize this into a dedicated field workflow, capability tools like ArcGIS Field Maps and ArcGIS Survey123 are built specifically for structured mobile data collection.
Streaming live sensor data
Real-time water quality sensors generate a continuous stream of readings that need to reach a map without manual re-entry. ArcGIS Velocity is built for exactly this kind of real-time data ingestion, offering a capability path for basins looking to formalize sensor-to-dashboard pipelines at scale.
Adding satellite and imagery context
Basin-wide monitoring benefits from consistent satellite coverage to track land use change, surface water extent, and erosion patterns over time. Capabilities under ArcGIS Image and Indo ArcGIS Living Atlas can supply this imagery and reference-layer foundation for a basin platform, independent of any specific NMCG deployment.
Inside PRAYAG: Linked Dashboards, Sensor Feeds, and District Accountability
PRAYAG, the Platform for Real-time Analysis of Yamuna, Ganga and their Tributaries, is best understood not as a single dashboard but as a basin-wide operational command layer. It functions as a collaborative environment for accessing information, data, maps, apps, and dashboards across the entire Ganga basin, built to support monitoring, review, and accountability rather than one-off reporting.
The clearest evidence of what this delivers comes from NMCG’s own published comparison of water quality data. Measured against a 2014 baseline, Dissolved Oxygen (DO) medians improved at 32 monitoring locations, Biochemical Oxygen Demand (BOD) medians improved at 43 locations, and Fecal Coliform (FC) medians improved at 25 locations, based on data through September 2023.
The stretch of the Ganga from its origin to Haridwar has reached Class A, the highest water quality standard.
Underpinning this is a web-centric water quality dashboard built on seven years of data, from 2014 to 2021, covering four parameters: DO, BOD, FC, and pH. The data is processed using a percentile-based statistical method, and users can filter results by state, district, station, and year.
“Esri’s Manual & Real Time Water Quality Information dashboard, which is embedded in PRAYAG, had brought a paradigm shift in the visualization of all crucial spatial and non-spatial water quality related information of Ganga basin to adopt accurate and transparent decisions in Namami Gange flagship program,” said Peeyush Gupta, Real Time Information Specialist, National Mission for Clean Ganga.
The PRAYAG environment also hosts several linked, purpose-built dashboards, including the Ganga Tarang portal, a Project Management Tool (PMT) dashboard, and the Ganga Districts Performance Monitoring System, each geospatially referenced and updated in near real time.
NMCG has reported the addition of 40 more real-time water quality monitoring stations across the basin. These expand coverage alongside monitoring for parameters beyond the core four, including turbidity and conductivity, which extend the platform’s read on basin health.
This is also where PRAYAG connects to administrative accountability rather than staying a technical dashboard. The same 4M review structure that runs 139 District Ganga Committees can draw on this shared spatial data during monthly meetings, turning a live map into the evidence base for a formal governance process rather than a display screen no one is required to act on.
NMCG separately maintains the Ganga Knowledge Portal, an in-house repository built and operated by NMCG itself, offering researchers and the public access to over a thousand documents, datasets, and technical reports. This portal sits alongside PRAYAG as a public knowledge resource rather than as part of the GIS dashboard environment.
Basin managers and government agencies evaluating similar platforms for other Indian rivers can look at how water resource management solutions support this kind of basin-scale monitoring and planning work.
Beyond Water Quality: Digital Twins, Glacier Monitoring, and Riverbed Mapping
In November 2025, NMCG’s 67th Executive Committee approved a set of research projects that push basin monitoring well beyond water quality parameters alone, into hydrology, geomorphology, and groundwater. These are approved research initiatives, not yet operational systems, but they signal where a basin-scale spatial platform is headed next.
| Initiative | Scope |
| Digital Twin and Water Cycle Atlas | AI, satellite remote sensing, and hydrological modelling for the Ganga Basin |
| Glacier melt-runoff study | Upper Ganga Basin glacier retreat and flash flood/GLOF risk, led by the National Institute of Hydrology, Roorkee |
| SONAR bathymetric survey | 1,100 km underwater topographic baseline from Bijnor to Ballia |
| Historical map digitization | Pre-1900 to post-1950 maps into a GIS database with a secure geo-portal |
| Managed aquifer recharge (MAR) study | Paleochannel recharge sites in the Ganga-Yamuna Doab, Kaushambi to Kanpur, with groundwater level monitoring at six locations |
Taken together, these five projects mark a shift in emphasis, from monitoring current river conditions toward predicting river behaviour, moving basin management from observational GIS toward a more predictive form of basin intelligence.
Once operational, the approved Digital Twin and Water Cycle Atlas project would combine hydrological modelling, AI, and satellite remote sensing into a live virtual model of the Ganga Basin, letting planners simulate basin conditions rather than only observe them after the fact. The glacier melt-runoff study addresses a part of the basin that water quality dashboards don’t reach at all: the Himalayan headstreams, where changing snow cover and melt patterns affect everything downstream, including flash flood and Glacial Lake Outburst Flood (GLOF) risk.
The SONAR bathymetric survey adds a dimension no surface-level dashboard can capture, an underwater topographic baseline that supports sediment management, hydrodynamic modelling, and environmental flow assessment along a 1,100-kilometer stretch. Meanwhile, the historical map digitization project turns pre-1900 to post-1950 maps into a searchable geospatial database, giving planners a time axis for analyzing river morphology and floodplain change that live sensors alone cannot provide. The managed aquifer recharge study connects the basin platform to groundwater security. It examines how paleochannels between Kaushambi and Kanpur could be used for recharge, an increasingly important link given how much basin planning still treats surface water and groundwater as separate problems.
Challenges and the Road Ahead
Infrastructure and connectivity remain uneven across the basin
NMCG’s own project documentation identifies that remote or inaccessible stretches of the basin often lack the infrastructure and connectivity needed for seamless real-time data transmission. A dashboard is only as current as its weakest sensor link, and closing this gap matters more as the platform expands into the SONAR survey and glacier monitoring work with genuinely remote endpoints.
Data accuracy depends on consistent equipment and protocols
Ensuring reliable readings requires calibrated monitoring equipment and standardized measurement procedures across every station in the network. As more sensor types and data sources get added, including the newer glacier and bathymetric research streams, maintaining that consistency becomes a larger operational task than it was when the platform covered water quality alone.
Capacity building and organizational collaboration take sustained investment
Effective use of the dashboard and app ecosystem depends on adequately trained personnel, and coordinating data sharing among NMCG, CPCB, state pollution boards, and local communities requires ongoing organizational alignment, not a one-time integration project. Differences in how state and central datasets are structured and referenced can also slow down the kind of seamless data sharing a shared geospatial platform is meant to enable.
Replicating the model elsewhere means solving different problems in each basin
The Ganga’s monitoring framework offers a template for basins like the Yamuna, Brahmaputra, and Cauvery, but the underlying constraints won’t be identical. Sensor maintenance costs, inter-state data-sharing arrangements, and the density of administrative bodies willing to act on dashboard alerts will all vary, meaning a basin platform elsewhere would need its own institutional groundwork, not just a technology copy-paste.
The Ganga carries drinking water, agricultural irrigation, and cultural significance for hundreds of millions of people across five states, and for just as long, understanding its condition meant waiting for a report to catch up with reality. A network-wide monitoring platform closes that gap, turning what used to be a retrospective account of what already happened into a live picture that district committees, state agencies, and national planners can act on together, in the same river cycle the data was collected in.
For water resource agencies evaluating GIS platforms for river basin monitoring, real-time spatial intelligence is becoming the foundation for faster, more coordinated decision-making across India’s river systems. The Ganga is increasingly managed not as a collection of monitoring stations, but as a living digital network, and that shift may well become the blueprint for how every major river basin in India is governed next.
FAQs
1.What is real-time GIS river basin monitoring?
Real-time GIS river basin monitoring links live sensor networks, satellite imagery, and field data tools to a shared spatial platform, mapping every reading to its location as it’s recorded. It replaces periodic manual sampling with a continuously updated, network-wide view of river conditions.
2.What is the PRAYAG platform and how does NMCG use it?
PRAYAG (Platform for Real-time Analysis of Yamuna, Ganga and their Tributaries) is NMCG’s collaborative platform for maps, apps, and dashboards across the Ganga basin. NMCG uses it for monitoring, review, and accountability, linking water quality data with project management and district performance tracking.
3.Which ArcGIS products support Ganga basin monitoring dashboards?
NMCG’s documented deployment uses ArcGIS for visualization, ArcGIS Online for collaboration, and ArcGIS mobile applications for field data collection. Organizations building similar basin-monitoring dashboards can also work through the ArcGIS Enterprise portal, a self-managed environment for hosting and sharing this kind of web GIS content internally.
4.What does real-time water quality monitoring measure in the Ganga basin?
The core, verified parameters are Dissolved Oxygen (DO), Biochemical Oxygen Demand (BOD), Fecal Coliforms (FC), and pH, tracked through a seven-year percentile-based dashboard. Turbidity and conductivity extend coverage as the sensor network has grown.
5.What are the main challenges in scaling real-time GIS to other Indian river basins?
The biggest hurdles are infrastructure gaps in remote stretches, maintaining data accuracy across a growing sensor network, and sustaining the capacity building and coordination that make a dashboard useful. Replicating the model in basins like the Yamuna, Brahmaputra, or Cauvery would need basin-specific work on sensor economics and data-sharing, not just a technology rollout.
Written by
Esri India Marketing