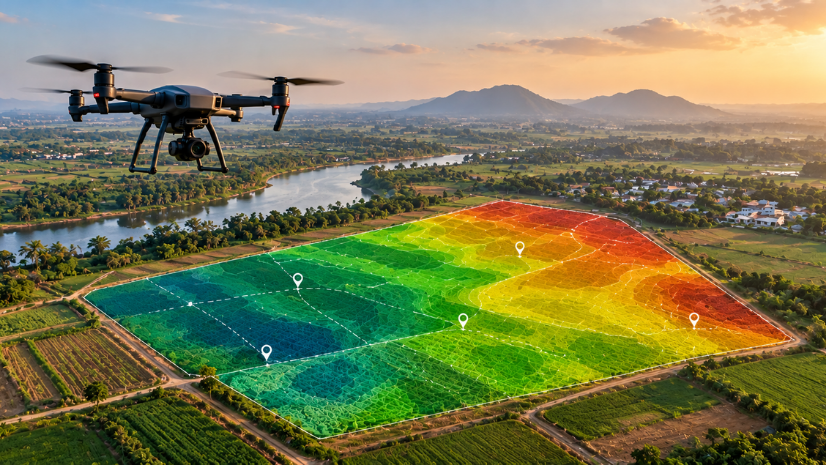
A Geographic Information System (GIS) organizes information by where it happens, so a project’s physical progress and its location can be viewed together rather than as separate reports. India’s Sagarmala Programme, a national push for port-led development spanning 7,500 kilometers of coastline, is exactly the kind of large, multi-agency effort GIS is built to support.
Introduction: Tracking 845 Projects Along 7,500 Kilometres of Coastline
Sagarmala is not one project but a portfolio of 845, spread across India’s coastal states and implemented by a mix of central ministries, state governments, and port authorities. As of the government’s most recent update, 315 of these projects are complete, 210 are under implementation, and 320 remain in the planning stage.
Keeping track of 845 projects moving through different stages, in different states, under different implementing agencies, is as much a data management challenge as an infrastructure one.
What Would GIS-Based Monitoring of a Programme Like Sagarmala Actually Look Like?
At its simplest, GIS-based monitoring means showing project data on a map rather than only in a spreadsheet or a table of totals. A national total of 315 completed projects is useful, but it does not show whether those completions are concentrated on one coast or spread evenly, or whether delays are clustering around a particular state or project type.
A spatial view adds that layer. Instead of a single count, a program manager could see where each project sits geographically, what stage it is in, and how it relates to other projects nearby, such as a port modernization effort and the road or rail connectivity project meant to serve it.
Inside the Sagarmala Programme: Pillars, Progress, and the Coordination Challenge
Sagarmala was approved by the Union Cabinet in March 2015, built around a National Perspective Plan structured across five pillars: port modernization and new port development, port connectivity enhancement, port-led industrialization, coastal community development, and coastal shipping and inland waterways transport. The National Sagarmala Apex Committee, constituted in May 2015, provides overall policy guidance and oversight for the program.
Progress so far is substantial by the government’s own figures. Of 845 total projects, 120 completed port modernization projects have added more than 400 million tonnes per annum of capacity, and 106 completed road and rail connectivity projects have strengthened the links between ports and their hinterlands. Coastal shipping cargo has grown from 87 to 195 million tonnes per annum, a rise of 118 percent, and inland waterway cargo has grown from 18.10 to 145.50 million tonnes per annum, a rise of 700 percent. The government estimates the program’s cumulative employment potential at around 1 crore jobs, comprising 40 lakh direct and 60 lakh indirect roles.
Central ministries, the Inland Waterways Authority of India, Indian Railways, state governments, and major ports all implement projects under the program. That breadth is the coordination challenge: a program this size depends on many organizations reporting progress in a way that adds up to one coherent national picture.
Why a Multi-Agency, Multi-State Programme Needs a Spatial View
What is actually documented about how Sagarmala tracks this progress today is a web-based application, run through the National Technology Centre for Ports, Waterways and Coasts, that automates the capture of project inputs from the concept and proposal stage onward. Government material describes this system as a tool for nodal officials to monitor physical and financial progress, project delays, bottlenecks, and approvals pending with the Ministry.
A program spanning multiple ministries, multiple state governments, and agencies such as IWAI and Indian Railways runs into a familiar problem at this scale: each agency tends to see its own slice of progress, in its own format, on its own timeline. A spatial layer would not replace that reporting, but it could give every contributing agency, and the Ministry overseeing all of them, a shared frame of reference, tied to actual project locations rather than agency-specific spreadsheets.
How ArcGIS Pro, ArcGIS GeoBIM, and ArcGIS Enterprise Can Support Sagarmala’s Workflows
ArcGIS Pro and ArcGIS GeoBIM support Sagarmala workflows at every stage, from port site selection overlaid with bathymetric data and ecological exclusion zones, through hinterland road and rail connectivity planning to reduce logistics costs, to port construction monitoring through drone surveys managed by Site Scan for ArcGIS.
A platform such as ArcGIS Enterprise can consolidate data submitted by multiple contributing agencies into a single system of record, rather than leaving it scattered across separate databases and reporting formats. For a program like Sagarmala, that would mean project data from IWAI, Indian Railways, state maritime boards, and major ports could, in principle, sit inside one platform, tied to a common location reference rather than reconciled manually after the fact.
A Shared Layer on Top of Existing Reporting
This kind of platform does not replace the reporting each agency already does. What it can add is a layer that pulls existing project data together, so a project’s physical progress, financial status, and location are visible in one place instead of requiring a separate request to each implementing agency. A reference layer from the Indo ArcGIS Living Atlas, covering India’s coastline, administrative boundaries, and transport networks, could give that data geographic context without every agency needing to build its own base maps from scratch.
How ArcGIS Dashboards Can Turn Project Status Into a Shared, Live Picture
Once project data is consolidated, the next problem is making it usable for the people who need to act on it. A platform such as ArcGIS Dashboards is designed to turn consolidated operational data into a real-time, single-screen view, built around different audiences: a strategic dashboard for executives tracking program-wide indicators, a tactical dashboard for analysts examining trends across regions, and an operational dashboard for staff monitoring the live status of individual projects.
For a program the size of Sagarmala, this kind of dashboard could let a nodal official see, at a glance, which projects are on track, which are delayed, and where those delays are concentrated geographically, without waiting for each implementing agency to submit a separate status update.
How Indian Infrastructure Programmes Are Approaching Geospatial Monitoring Today
Connecting Sagarmala’s port nodes to the PM Gati Shakti National Master Plan’s GIS layer gives port investments the multimodal planning context needed to translate into inland economic value, not just maritime throughput, tying port modernization to the road, rail, and logistics networks that carry that value onward. At the India Ports Conference 2024, geospatial technology’s role in supporting traffic and large vessel movement at ports such as Rotterdam was highlighted as relevant to India’s own port modernization push.
Sagarmala’s own project-tracking runs through a web-based application built by the National Technology Centre for Ports, Waterways and Coasts, alongside the ArcGIS-based site selection, connectivity planning, and drone-survey monitoring work already supporting the program’s execution.
Challenges and the Road Ahead
Inconsistent Data Formats Across Agencies
Central ministries, state governments, IWAI, Indian Railways, and major ports have each developed their own reporting systems over years of separate operation. Bringing that data into one consolidated, spatially referenced format is a sustained integration task, not a one-time technical fix.
Coastal and Multi-State Jurisdiction Boundaries
Sagarmala projects cross state lines and coastal jurisdictions with different administrative boundaries and regulatory processes. A single spatial view has to reconcile these boundaries accurately, which adds complexity beyond simply plotting project locations on a map.
Staffing and Training Across Ministries
Maintaining a shared platform across multiple implementing agencies requires staff at each agency trained to use it consistently, not just a central team that understands the technology. Without that distributed capability, a consolidated system risks becoming another single point of dependency rather than a genuinely shared tool.
Standardizing Reporting Across States With Different Priorities
State governments involved in Sagarmala projects operate under their own priorities and reporting conventions. Getting consistent, comparable data from every state into one system is as much a coordination and governance question as a technical one.
Whether that extends into a fully consolidated, agency-wide project-tracking view will depend on how many of the implementing agencies bring their own reporting into a common spatial frame, rather than on the technology alone.
FAQs
1.What is the Sagarmala Programme?
Sagarmala is a Government of India program approved in March 2015 for port-led development along India’s 7,500-kilometer coastline, built around five pillars: port modernization, port connectivity, port-led industrialization, coastal community development, and coastal shipping and inland waterways transport.
2.How many projects has Sagarmala completed so far?
As of the government’s most recent update, 315 of the program’s 845 total projects are completed, 210 are under implementation, and 320 remain in the planning stage.
3.How does Sagarmala track project monitoring today?
Sagarmala’s monitoring system is a web-based application run through the National Technology Centre for Ports, Waterways and Coasts, tracking physical and financial progress, delays, and pending approvals across the program’s 845 projects.
4.Which ArcGIS products already support Sagarmala’s execution?
ArcGIS Pro and ArcGIS GeoBIM support port site selection, hinterland connectivity planning, and port construction monitoring, with drone surveys managed through Site Scan for ArcGIS.
5.How can ArcGIS Dashboards support large infrastructure program tracking?
ArcGIS Dashboards can turn consolidated project data into a real-time, single-screen view tailored to different audiences, from program-wide indicators for executives to live project status for operational staff.
6.What are the main challenges in applying GIS to a program the scale of Sagarmala?
Reconciling inconsistent data formats across implementing agencies, working across multi-state jurisdiction boundaries, training staff across ministries to maintain a shared platform, and standardizing reporting across states with different priorities are the main practical hurdles.
Written by
Esri India Marketing