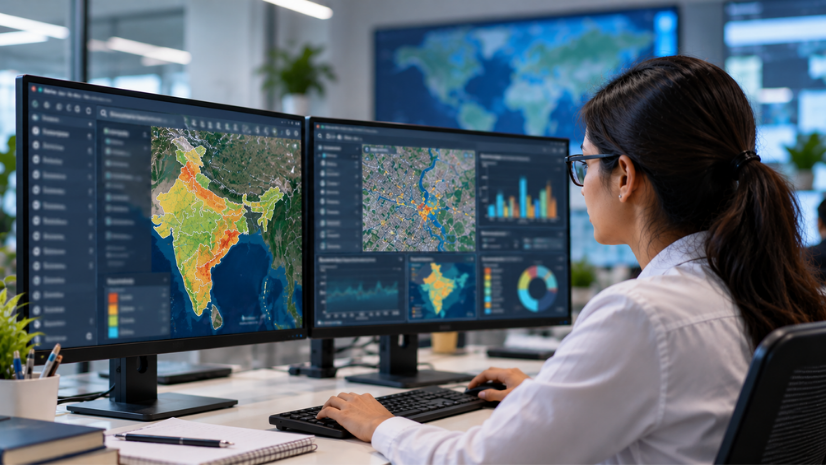
Geographic Information System (GIS) for mass event safety refers to the use of location-based technology to plan, monitor, and manage the movement of large crowds at religious gatherings, sporting venues, and civic events. In India, where a single festival can draw crowds larger than most countries’ populations, GIS turns ground data into maps that planners, police, and emergency teams can act on before, during, and after an event.
Introduction: India’s Unique Scale of Mass Gatherings
India hosts some of the largest planned human gatherings on Earth. The Maha Kumbh Mela 2025 in Prayagraj ran for 45 days across roughly 4,000 hectares, and official post-event figures put attendance at more than 66 crore (660 million) devotees, according to Uttar Pradesh government data reported by Deccan Herald. On the sporting side, Narendra Modi Stadium in Ahmedabad seats 132,000 spectators, making it the largest cricket venue in the world, and it regularly fills up for IPL matches and international fixtures.
At this scale, a few thousand people moving the wrong way at the wrong pinch point can turn a celebration into a tragedy. You need more than barricades and loudspeakers to manage crowds like these. This is where GIS earns its place: it gives organizers a shared, location-based picture of the ground, the crowd, and the risk, updated in real time.
What Is GIS for Mass Event Safety?
GIS for mass event safety is the practice of mapping an event’s physical layout, overlaying live crowd and sensor data on it, and using both to guide decisions before a crush or stampede develops. It combines a base map of the venue with real-time feeds such as CCTV, drones, and IoT sensors, then adds crowd density and flow analysis on top. You can think of it as the operational nervous system that connects what is happening on the ground to the people making decisions in a control room.
The discipline draws on concepts such as crowd density measured in persons per square meter, Level of Service ratings that classify how congested a walkway is, and pedestrian flow modelling that predicts where bottlenecks will form. Tools like ArcGIS Pro lets planners build and analyze these layers, while ArcGIS Dashboards turns them into live visual displays for command centers.
India’s Mass Event Landscape: Religious, Sporting, Civic
Religious gatherings make up the largest and most complex category. The Kumbh Mela rotates between Prayagraj, Haridwar, Ujjain, and Nashik, while shrines such as Sabarimala in Kerala, Vaishno Devi in Jammu and Kashmir, Tirumala-Tirupati in Andhra Pradesh, and the Char Dham and Amarnath Yatras in the Himalayas draw millions of pilgrims across weeks or months every year. Rath Yatra in Puri adds another dimension: a moving procession rather than a fixed venue, which changes how crowd corridors need to be planned.
Sporting venues bring a different challenge: a fixed, high-density structure that must fill and empty safely within a few hours. Stadiums such as Narendra Modi Stadium, Eden Gardens in Kolkata, Wankhede in Mumbai, and M. A. Chidambaram in Chennai host the IPL, international cricket matches, and other franchise sports leagues, each with its own gate, seating, and exit geometry to manage on match day.
Civic events, including elections, Republic Day parades, and state functions, round out the picture. These events are usually shorter but still require coordination between police, municipal bodies, and disaster response units such as the NDRF and SDRFs across a defined public space.
How GIS Maps the Event Before It Begins: Pre-Event Planning
Before a single pilgrim or spectator arrives, planners need an accurate base map of the site. Products such as ArcGIS Pro let teams digitize roads, ghats, gates, and facilities into a single shared layer, while ArcGIS Reality and Site Scan for ArcGIS support drone-based aerial surveys of large temporary sites like Kumbh Mela grounds. This base map becomes the foundation that every department, from sanitation to security, works from.
One workflow that deserves more attention is walk accessibility analysis. A peer-reviewed study published in the Journal of Transport Geography used GIS to audit road stretches in Ujjain during the Kumbh Mela, scoring accessibility for elderly and differently abled pilgrims and mapping a hierarchy of accessible zones for the city. This kind of analysis predicts pinch points and bottlenecks on paper, long before they form in a crowd.
For a temporary mega-city like a Kumbh Mela ground, this planning extends further: sectors, akharas, water and sanitation grids, fire posts, medical camps, and lost-and-found kendras all need to sit on one coordinated base map rather than in separate department files. Tools such as ArcGIS Network Analyst can then model evacuation routes and escape times across that same layout.
The Live Operations Layer: Real-Time Crowd Management
Once the event begins, planning maps have to turn into live operational awareness dashboards. Real-time feeds from CCTV with AI video analytics, drones, and IoT crowd sensors can be streamed and processed with ArcGIS Velocity, which is Esri’s current platform for real-time and IoT data analytics. ArcGIS Dashboards then displays this information as a live, map-based command view for an Integrated Command and Control Centre, showing crowd density hotspots as they emerge rather than after the fact.
On the ground, field personnel and volunteers can use ArcGIS Field Maps to report conditions, log incidents, or update facility status from a phone, while ArcGIS Survey123 supports structured data collection such as medical camp intake or lost-and-found registrations. Together, these tools connect what a sensor sees, what a control room analyst sees, and what a person standing at a gate sees, onto the same map.
Post-Event Learning: Analytics, Audit, and Continuous Improvement
A mass event does not end when the crowd goes home. The data collected, from crowd density readings to incident logs, becomes the basis for a post-event audit. ArcGIS GeoAnalytics Server can process this historical, large-scale data to identify where congestion repeatedly built up, which routes performed better than expected, and where infrastructure changes would help most.
These findings feed directly back into the base map for the next edition of the same event. Since events such as Kumbh Mela recur on a fixed cycle, and IPL returns to the same stadiums every season, this audit-to-planning loop is what allows crowd management to improve year over year instead of restarting from scratch each time.
How Indian Authorities and Organizers Are Using GIS Today
Esri India has already put this approach into practice at scale. Ahead of the Maha Kumbh Mela 2025, Esri India launched a GIS-based public web app called Kumbh Locator. The app required no login or download and helped pilgrims navigate the Kumbh Mela grounds, according to Esri India’s own announcement and multiple press reports at the time. It mapped accommodations, snan ghats, parking, roads with live traffic, weather updates, entry and exit points, lost-and-found centers, e-rickshaw stands, police stations, fire stations, and hospitals, and it also carried ArcGIS StoryMaps content on nearby temples and tourist sites.
This kind of public-facing tool complements the authority-side planning done by bodies such as the Prayagraj Mela Authority and state police, who rely on GIS-based command dashboards internally. As India’s smart cities programs mature, the same base-map-plus-live-feed approach used at Kumbh is increasingly available to state and city government departments planning any large public event, not just religious gatherings.
Challenges and the Road Ahead
Data Silos Across Departments
Police, municipal bodies, health departments, and event organizers at most Indian mass events still maintain separate spreadsheets, radio logs, and paper records instead of one shared map. This means a road closure decided by traffic police may not reach the medical team planning ambulance routes, or a sanitation update may never reach the crowd control desk. A unified GIS layer that every department reads from and writes to would close this gap, but building it requires departments to agree on data ownership and update responsibility well before the event begins, not during it.
Real-Time Bandwidth at Remote Pilgrimage Sites
Locations such as Amarnath, the Char Dham circuit, and parts of the Sabarimala route sit in mountainous or forested terrain with limited mobile connectivity. Streaming CCTV, drone, and IoT sensor feeds into a live dashboard is far harder here than at a city stadium with fiber and 5G already in place. Until network infrastructure catches up, these sites will likely depend more on periodic data syncs and satellite links than on continuous live feeds, which changes how quickly a control room can react to a developing crowd surge.
Balancing Surveillance with Privacy
AI video analytics, RFID wristbands, and ANPR cameras are becoming more common at Indian mass events, and each adds another layer of location data collected on ordinary pilgrims and spectators. Authorities have not yet settled on clear, public policies on how long this data is retained, who can access it, and when it gets deleted after an event ends. Getting this right matters for public trust, since crowd safety systems work best when people believe the data collected about them is being used only to keep them safe.
Indoor Mapping for Stadiums
Indoor GIS is a workflow gap in Indian stadiums today. ArcGIS Indoors, as a capability, can model gate-to-seat routing, food and beverage zone density, and evacuation paths inside a venue, the same way it already supports airports and large campuses internationally. Indian cricket and football stadiums have not adopted this kind of indoor mapping at the same pace, which means match-day safety still relies more on manual steward deployment than on a live, floor-aware digital model of the venue.
None of these challenges are reasons to wait. Many of the crowd crushes studied in India, from Kumbh grounds to temple steps, point to a similar root cause: a gap between what was happening on the ground and what decision-makers could see in time to act. Closing that gap with better maps and faster data is, ultimately, a matter of protecting people who came to celebrate, worship, or cheer, and expected to go home safely.
FAQs
1.What is GIS-based crowd management?
GIS-based crowd management uses mapped venue layouts combined with real-time data, such as camera feeds and sensor readings, to track how crowds move and where congestion is building. It helps organizers spot dangerous density levels before they turn into a stampede, rather than reacting after the fact.
2.How is GIS used at Kumbh Mela?
At Kumbh Mela, GIS supports both pre-event planning, such as mapping ghats, roads, and medical camps, and live operations, such as tracking crowd density during peak bathing days. Esri India’s Kumbh Locator web app is one public example, helping pilgrims navigate facilities using a GIS-based map.
3.How do IPL stadiums manage crowd safety?
IPL stadiums manage crowd safety through gate-wise entry planning, CCTV monitoring, and coordination between police, stewards, and franchise operations staff. Location-based tools can model seat-to-exit routes and monitor entry and exit flow, though indoor GIS adoption varies by venue.
4.What role does GIS play in stampede prevention?
GIS helps prevent stampedes by identifying pinch points and bottlenecks during planning, and by flagging rising crowd density in real time so authorities can redirect people before a corridor becomes overloaded. Walk accessibility studies, like the one conducted for Kumbh in Ujjain, are one example of this planning approach.
5.How does ArcGIS Indoors help in stadium operations?
ArcGIS Indoors, as a capability, can support floor-aware mapping of a stadium’s gates, concourses, and exits, helping operators plan seat-to-exit routes and locate first-aid or security posts. This kind of indoor mapping is more established internationally than in Indian stadiums today.
Written by
Esri India Marketing