Picture this: You’re managing a power grid serving 2 crore customers, or running the gas distribution for half the city. But your control room still looks like something from 2010. When a transformer fails, or when someone reports a gas smell, your field engineers spend hours going through outdated paper maps, trying to figure out where the problem is.
If this sounds familiar, then you’re still managing massive networks of cables, pipes, and transformers spread across hundreds of square kilometres as separate pieces instead of one inter-connected system.
Geographic Information System (GIS) solves this by giving you what you’ve always needed: complete utility network visibility in one place. Let’s take a look at how GIS platforms like ArcGIS® help utility providers in India.
What is a GIS Utility Network?
A GIS utility network creates one intelligent system that understands how every transformer, cable, pipeline, and valve actually connects together.
Traditional systems might tell you that there’s a transformer at this particular location. But they can’t tell you which customers lose power when that transformer fails. A utility network powered by a GIS can. That’s the difference.
Key components that make this GIS utility network work
Assets: Every physical piece of equipment (transformers, substations, pipelines, valves) gets mapped with precise locations and technical specifications.
Connectivity: The system understands how assets link together. So, clicking on any component instantly shows what feeds into it and what depends on it downstream.
Topology: Network rules define how electricity flows through circuits or how gas moves through pressure zones, enabling realistic modelling of your actual operations.
With these components in place, you can trace networks, analyse loads, and understand exactly how outages or maintenance will affect customers before making any changes. It’s the difference between guessing and knowing.
What are the capabilities of ArcGIS® Utility Network?
Esri India’s ArcGIS® Utility Network solution transforms how utilities manage their infrastructure by digitising electric and gas networks on one unified platform.
Real-Time Network Intelligence
The platform integrates with Supervisory Control and Data Acquisition (SCADA) systems and IoT sensors to bring live operational data into your GIS environment.
Through partnerships like OSISoft PI Integrator, utilities get real-time parameters like voltage, current, and gas flow readings with full spatial context. Smart meter data streams directly into the network model, providing granular consumption patterns and outage detection capabilities.
When something changes in your network, you see it instantly on the map.
Advanced Network Tracing
Network tracing capabilities include:
- Upstream/downstream impact analysis – See exactly what’s affected by any shutdown
- Subnetwork management – Understand how different voltage levels or pressure zones connect
- Stepwise tracing – Follow complex network paths across multiple system tiers
Questions like “Which customers lose power if I isolate this feeder?” get answered in seconds.
Enterprise-Ready Architecture
Built on ArcGIS® Enterprise‘s web GIS pattern, the system enables organisation-wide access via web browsers, mobile apps, and ArcGIS® Pro. Real-time edits from field workers sync immediately across the entire organisation.
ArcGIS® Utility Network operates at all scales of resolution, allowing utilities to start small with basic network asset management and scale up as needed. You can manage a single pressure zone or cover massive DISCOM territories across entire states. The platform will adapt to your organisation’s size and complexity requirements.
What is the Impact of GIS in Electric Network Management?
Managing India’s electricity grid without proper visualisation is like flying blind through a thunderstorm. A GIS software like ArcGIS® gives field engineers and operators complete visibility into their grid infrastructure. Here’s how:
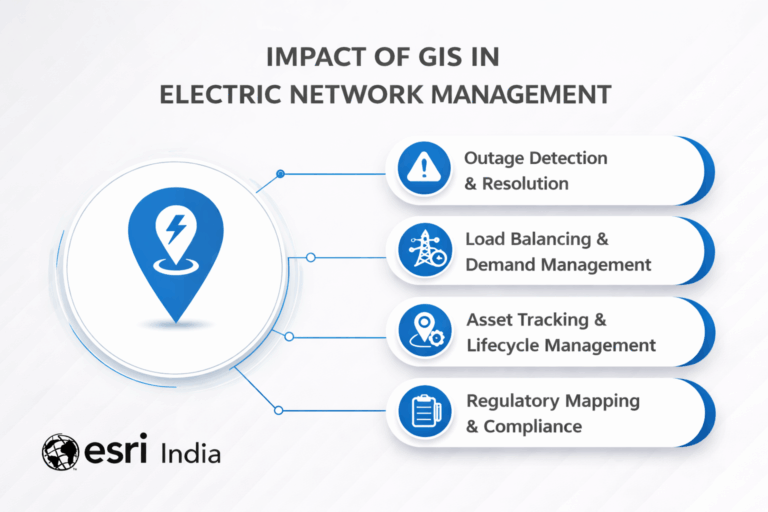
Outage Detection & Resolution
When customers report outages, the GIS system instantly maps affected areas and identifies probable fault locations by analysing network topology. Smart meter integration enables automatic outage detection. So, when meters go offline, the GIS software immediately pinpoints the problem area and estimates how many customers are affected.
Field teams get dispatched with precise GPS coordinates, optimal routing, and complete asset information. So, instead of searching neighborhoods for fault locations, teams arrive at the exact spot with the right equipment. This ensures that repairs are faster with less downtime.
Load Balancing & Demand Management
GIS enables extensive load analysis by combining network maps with customer consumption data. This helps utilities identify overloaded feeders and redistribute loads across multiple circuits, optimising power flow during peak demand periods.
Geographic visualisation shows exactly where demand is concentrated. This helps operators make informed switching decisions.
Asset Tracking & Lifecycle Management
Every transformer, cable, and switch gets mapped with exact locations, technical specifications, and maintenance histories. GIS-based asset management enables utilities to track equipment performance across their service territory. This allows for scheduled maintenance based on geographic clusters, and plan replacements before failures occur.
Regulatory Mapping & Compliance
GIS supports regulatory compliance by maintaining accurate records required by the electricity regulatory commissions across different Indian states. This includes service territories, equipment specifications, and network configurations.
What is the Impact of GIS in Gas Pipeline Operations?
Managing gas distribution networks means ensuring every pipeline, valve, and pressure regulator are in perfect coordination to keep communities safe and supplied. Here’s how a GIS assists gas utilities with such operations:
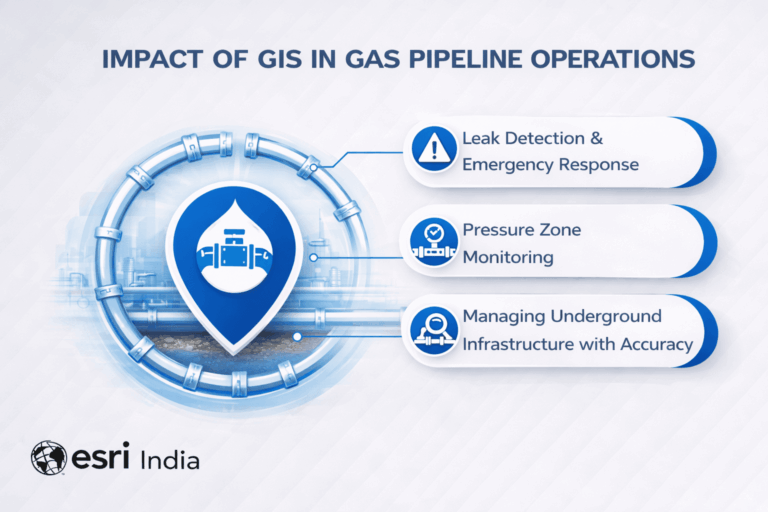
Leak Detection & Emergency Response
When someone calls about smelling gas, GIS-based systems get to work. The system pinpoints exactly where the problem likely is on digital maps, eliminating the need for field workers wandering around with handheld detectors. Field teams are then sent out with GPS coordinates, the fastest route, and everything they need to know about that specific pipeline section.
The smart systems even watch out for potential trouble, proactively. Real-time sensors scattered across the network feed data back to central maps. So, if gas concentrations spike anywhere, operators know about it immediately.
Pressure Zone Monitoring
Gas doesn’t just flow as it wishes through pipes. There’s actually a careful hierarchy. For example, high pressure for long-distance transport, medium pressure for neighborhoods, and low pressure for individual homes. GIS maps this entire pressure ecosystem, so operators can see how changes in one area ripple through the whole network.
Pressure regulators and control stations show up on these maps with live performance data, helping prevent those scary pressure surges that make the evening news.
Managing Underground Infrastructure with Accuracy
Here’s the real challenge: most gas infrastructure is completely invisible, buried under roads and sidewalks. GIS creates detailed underground maps showing every pipe, its age, what it’s made of, and how deep it sits.
Modern 3D GIS enables field teams to see underground networks from any angle, which is critical when construction teams need to dig beneath the ground. Nobody wants to accidentally hit a gas line.
What are some Utility Network use cases in India?
Let’s look at how real Indian utilities are actually using GIS to solve everyday operational headaches. These are full-scale implementations that are making a significant impact.
BSES Yamuna Power Limited – Delhi Electricity Distribution
BSES Yamuna Power Ltd. (BYPL) serves over 14 lakh customers across East and Central Delhi, covering major districts like Laxmi Nagar, Chandni Chowk, and Mayur Vihar. Before implementing GIS, they were struggling with basic operational challenges that sound all too familiar.
Problems: Predicting equipment failures and managing outages was a challenge. Further, the process of planning and executing was considerably slow and time taking, resulting in high labour costs.
Esri India’s solution: Integrating ArcGIS® with BYPL’s existing SAP systems and creating one unified platform for scheme design and network management. Now their engineers can analyse high tension cables, substations, and conductors directly on maps. This made designing construction work much more efficient.
The results: 20% improvement in network engineer productivity. They’ve also cut labour costs, reduced design time, and can spot errors early in the planning process. Mobile access means field teams can work with smartphones and tablets instead of paper maps.
Read more about how Esri India helped BSES
Gujarat Gas Limited – State-Wide Natural Gas Distribution
Gujarat Gas Limited (GGL) serves over 10 lakh customers (CNG and PNG users) across 14 geographical areas throughout the state of Gujarat. Manually managing millions of gas pipelines across an entire state? Such a situation carries considerable risk.
Their worry: Emergency response. When someone reports a gas leak, you need to know immediately which customers to evacuate and where the nearest shutoff valves are. You also have to dispatch emergency teams with the right equipment.
The solution: Esri’s ArcGIS® for Utilities gave them enterprise-level web-GIS capabilities for real-time decision making.
The result: Now they can perform instant customer tracking, rapidly mobilise emergency teams, and access detailed pipeline information from any location.
Read more about how Esri India helped GGL.
Conclusion
India’s power and gas sectors are at a turning point. With over a billion people depending on reliable utilities, GIS utility networks aren’t just a nice-to-have technology. They’re absolutely essential for modernising how we deliver electricity and gas across the country.
It creates transparency, with complete visibility into networks. It drives efficiency through faster repairs, better planning, and smarter resource allocation. Most importantly, it sets the foundation for smart grid readiness, preparing utilities for tomorrow’s connected and automated infrastructure.
By applying The Science of Where®, Indian utilities can modernise their networks with speed and accuracy.
Esri India understands this and ArcGIS® Utility Network demonstrates this through successful implementations with BSES Yamuna, Gujarat Gas Limited, and other similar organizations.
For Indian utilities serious about modernisation, the question isn’t whether to implement GIS. It’s how quickly they can get started. Get in touch with an Esri India expert now!
Frequently Asked Questions
1. What is a GIS utility network used for in electricity?
Think of a GIS utility network as the ultimate digital map and brain for an electricity grid. It’s used to visualise every piece of the network. From power plants and substations to the cables reaching your home, showing exactly how they connect and work together.
This helps utility teams quickly spot outages, plan maintenance, balance loads, and understand how a problem in one spot might affect customers down the line. It’s like having a bird’s eye view and a magnifying glass all in one, making managing electricity networks way smarter and faster.
2. How does GIS help in managing gas pipelines?
Managing gas pipelines is a bit tricky because most of the network is underground and invisible. But GIS has the tools. It helps by creating super-detailed digital maps of every pipe, valve, and pressure zone. When there’s a leak or pressure issue, GIS can pinpoint the exact location instantly. This helps field teams get there faster and safer.
Plus, it keeps track of asset conditions so utilities know when something needs fixing before it becomes a big problem. Basically, GIS turns complex, hidden gas systems into clear, manageable maps that keep the gas flowing safely.
3. What is the difference between ArcGIS® Utility Network and traditional GIS?
Traditional GIS is like a map drawer. You get maps showing where things are, but not much about how they connect or function. ArcGIS® Utility Network takes it to the next level. It’s like turning those maps into a smart, living model that understands relationships, rules, and behaviours inside utility networks.
It tells you which customers will lose power if a particular transformer fails. Plus, it handles real-time data, large-scale network tracing, and integrates with other systems, making it an all-in-one tool for modern utility management.
4. Can GIS be integrated with SCADA systems?
Yes. GIS and SCADA are like two sides of the same coin in utility operations. SCADA handles real-time control and monitoring of equipment, while GIS provides the spatial context, telling where everything physically is on the network.
Integrating them means when SCADA picks up something unusual (like a pressure drop or a fault), the GIS platform can immediately show exactly where that is and what assets might be impacted. This combination powers faster decision-making and smarter field responses.
5. What challenges do utilities face when implementing GIS in India?
Implementing GIS in Indian utilities isn’t always a walk in the park. Some big challenges include messy or incomplete data like old paper maps, inconsistent records, or information scattered across departments.
Then there’s the scale: huge networks covering vast geographies with millions of assets. Getting your staff trained and comfortable with a new technology is another hurdle, but can be resolved with a comprehensive training program. Integrating GIS with existing IT systems, like billing or SCADA, can get complex, so consulting GIS experts is highly recommended.
But despite these challenges, the payoff of better reliability, faster outage response, and smarter planning is totally worth it.
Written by
Esri India Marketing