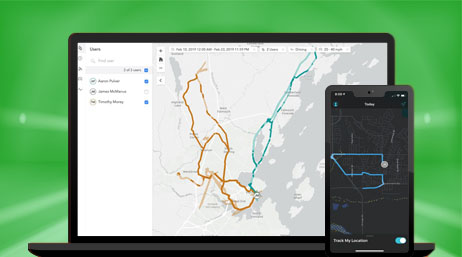
Apps for field operations
Improve coordination and operational efficiency in the field. Reduce errors and reliance on paper, boost productivity, and save money.


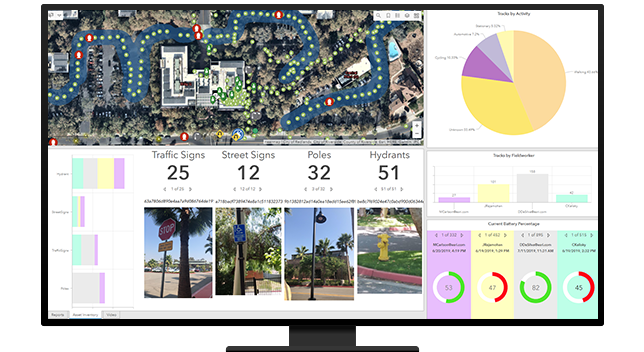
GIS allows you to organize your assets, understand their location and condition, and integrate your systems with leading asset management software. Mobile solutions help maintenance workers collect and inspect assets in the field. Give mobile workers the information they need to be more productive and keep assets in top condition.
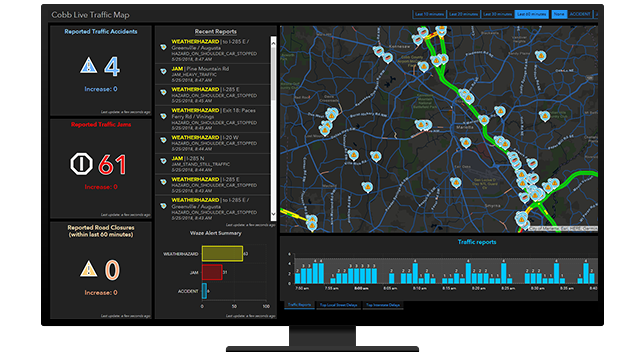
Advances in technology make it possible for agencies to make decisions in seconds rather than minutes or hours. Sensor data from buildings, personnel, vehicles, and even the environment can provide real-time feedback about what is happening in the field. Achieve efficient operations by using the most up-to-date data on conditions and community needs.
With GIS, public works crews and managers are operating on one authoritative source of information. Staff can now immediately analyze data collected in the field for a more action-oriented approach, supporting and connecting your staff working in the field and back in the office, operationalizing the information, and improving service quality.
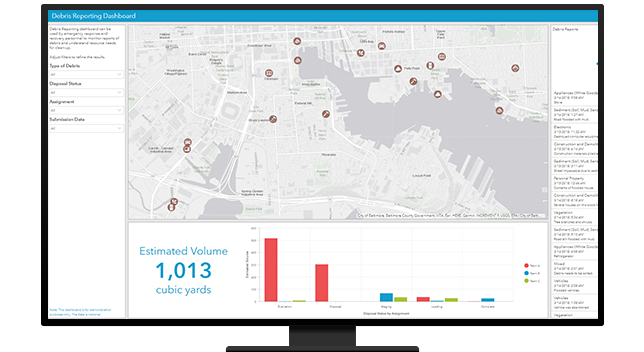
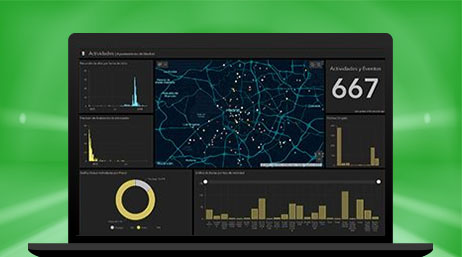
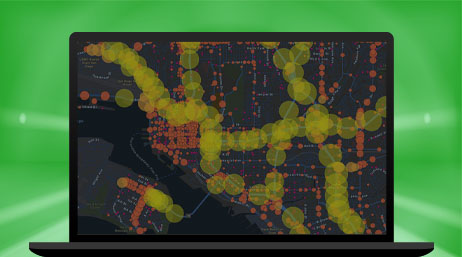
Expand the application of GIS with artificial intelligence and machine learning capabilities. You can better understand patterns and reduce impacts, adjust traffic conditions in real time, predict maintenance, monitor trash conditions, conduct asset management, and train computers and algorithms to identify blight.
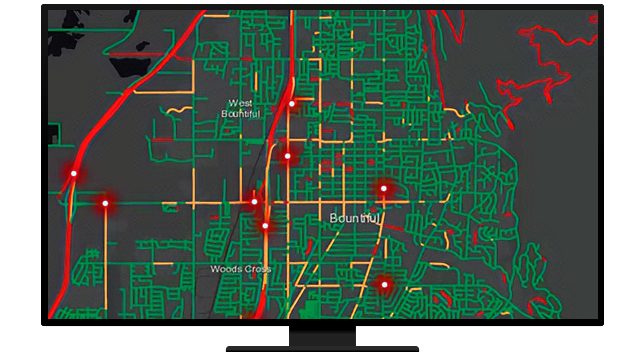
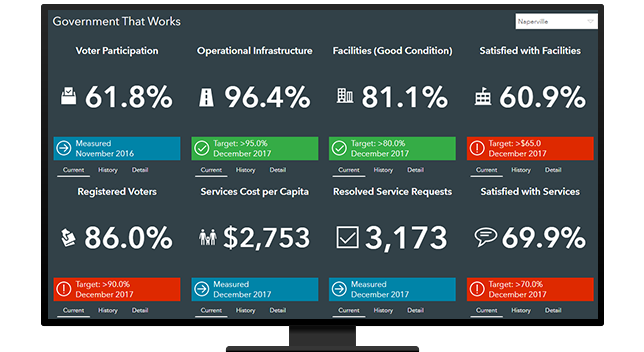
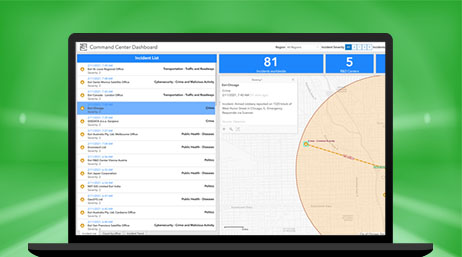
Raise the bar on performance with real-time measurement tools that help you keep everything on schedule and running smoothly. Monitor and adjust daily operations, from solid-waste pickup to winter maintenance and sign inventory. This new chapter in accountability and reliability is found not in static reports but on real-time dashboards.
Explore ArcGIS Solutions and product offerings that enhance operations and maintenance.
Apps for field operations

ROW Asset Inventory
ArcGIS Dashboards
ArcGIS GeoEvent Server
ArcGIS Velocity
Citizen Problem Reporter
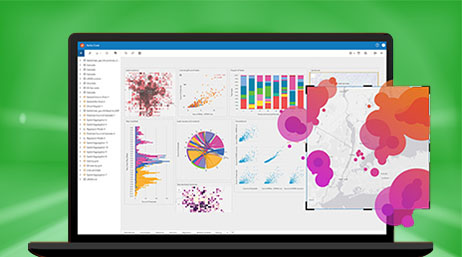
ArcGIS Insights
Please fill out your details below for us to contact you for the demo.
Write to us at info@esri.in
Talk to us over the phone