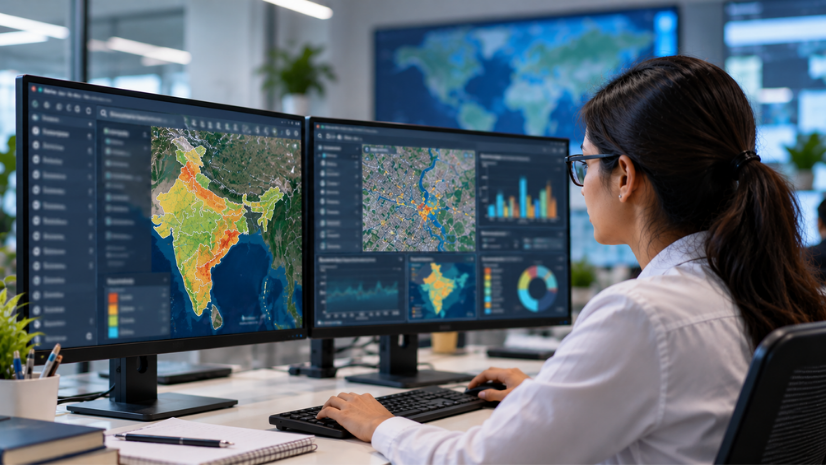
Geographic Information System (GIS) for the Election Commission of India (ECI) refers to the use of location-based technology to plan, deploy, and monitor the machinery behind a national election. India’s general elections involve over 10.5 lakh polling stations and roughly 97 crore registered voters, and GIS is one of the tools that help synchronize this machinery across phases, states, and terrain.
Introduction: The Logistical Marvel of Indian Elections
The scale of an Indian general election is difficult to overstate. For the 2024 Lok Sabha elections, the ECI set up more than 10.5 lakh polling stations to serve close to 97 crore registered voters. That effort was backed by 1.5 crore polling personnel and security staff and over 55 lakh EVMs, all coordinated across seven polling phases. These figures come directly from the Election Commission’s own pre-poll briefing.
Every one of those polling stations needs a presiding officer, a working Electronic Voting Machine (EVM), a security detail, and a route that gets people and equipment there and back safely. Doing this once is an achievement.
Doing it in near-simultaneous waves across a subcontinent, while accounting for deserts, forests, snowbound valleys, and river islands, is what makes Indian elections a genuine logistics problem before they are ever a political one. GIS gives election administrators a location-based way to plan and track that machinery.
What Does “Managing Polls at Scale” Actually Mean?
Managing polls at scale means coordinating people, equipment, and security across every polling station in a constituency at the same time, while making sure no single point of failure goes unnoticed. It covers everything from deciding where a booth should physically sit, to tracking the EVM assigned to it, to knowing whether a road to a remote hamlet is passable on polling day.
At its core, this is a location problem as much as an administrative one. A GIS layer that maps polling stations, routes, force deployment, and communication coverage in one place gives District Election Officers (DEOs) and Returning Officers (ROs) a single operational view instead of dozens of disconnected lists and spreadsheets.
The ECI’s Operational Map: Phases, Stakeholders, Touchpoints
A general election runs through distinct phases, from the announcement of the schedule and the Model Code of Conduct (MCC), to nomination scrutiny, campaigning, polling, and counting. Each phase has its own set of stakeholders: Chief Electoral Officers (CEOs) at the state level, DEOs and ROs at the district and constituency level, and Sector Officers who supervise a cluster of polling stations on the ground.
Beyond these officials, the ECI also deploys General Observers and Expenditure Observers to constituencies, and Micro-Observers to specific booths. Security forces are layered on top of this, including the Central Armed Police Forces (CAPF, comprising the CRPF, BSF, ITBP, CISF, and SSB), state police, and Quick Response Teams (QRTs). Each of these stakeholders needs to know where they are supposed to be, and a shared map is what lets a DEO see all of them at once rather than through separate reporting chains.
How GIS Powers Election Logistics
Before polling day, election administrators need to plan booth locations, polling party routes, and force deployment across an entire district or state. Tools such as ArcGIS Pro can support this kind of base mapping, letting planners lay out booth locations, roads, and administrative boundaries in a single shared layer. ArcGIS Network Analyst can then model the routes that polling parties, EVMs, and security personnel need to travel, accounting for vehicle type, road conditions, and accommodation halts along multi-day journeys.
This kind of route planning matters most in India’s difficult terrain. Every election, the ECI sets up a dedicated single-voter booth in Banej, deep inside Gujarat’s Gir forest, because election rules require that no voter travel more than two kilometers to reach a polling station. Similar terrain challenges apply to snowbound hamlets in Himachal Pradesh and Jammu and Kashmir, and to river-island booths in Assam. In remote, security-sensitive districts such as parts of Bastar and Sukma in Chhattisgarh, polling teams have relied on helicopter drops to reach the most inaccessible polling stations in recent elections, according to state election officials.
From EVMs to Booth-Level Monitoring: The Real-Time Layer
Once polling day arrives, the priority shifts to visibility. EVMs, which consist of a Control Unit and a Ballot Unit connected by a cable, go through First Level Checking (FLC) and are then dispatched to polling stations from designated dispatch centres. After polling, they are sealed and moved to strong rooms to await counting day, all under strict chain-of-custody protocols. A GIS-based, real-time streaming platform such as ArcGIS Velocity could support geo-fenced strong rooms and flag any unplanned movement of election material, though this remains a stated capability, not a confirmed feature of the ECI’s own systems.
On the citizen side, the ECI’s own cVIGIL app already uses geo-tagging in production: any citizen can photograph or film a suspected Model Code of Conduct violation, and the app auto-tags the location so flying squads can be dispatched to the spot. The Commission has publicly committed to acting on and responding to every cVIGIL case within a 100-minute window. Field personnel, such as Sector Officers and Booth Level Officers, can use mobile data collection tools like ArcGIS Survey123 to log conditions, incidents, or facility status directly from a polling station.
Webcasting adds another real-time layer. Coverage has expanded significantly over recent election cycles. Earlier practice limited live webcasting to sensitive and critical booths in a constituency, but the ECI’s more recent directives call for webcasting at all polling stations with internet connectivity, monitored through control rooms at the state, district, and constituency levels.
Counting Day, Result Dissemination, and Audit
Counting day runs on its own tight choreography. Strong rooms are opened under a formal protocol, votes are tabulated round by round, and a sample of Voter Verified Paper Audit Trail (VVPAT) slips is cross-verified against the electronic count at randomly selected booths in each constituency. The ECI’s in-house platform, ENCORE (Enabling Communications on Real-time Environment), is what Returning Officers actually use to digitize polled votes, tabulate round-wise data, and generate the statutory reports that counting day requires.
This same infrastructure supports transparency after the result is declared. The ECI has, in recent years, released dozens of granular statistical reports covering turnout, polling station data, and constituency-level results as part of its stated policy of maximum disclosure. Platforms such as Bharat Maps, a Government of India GIS platform built under the National GIS Mission, already give the public a geographic way to explore this kind of data. A dashboard built on similar GIS technology could extend that same idea, letting researchers see how a result unfolded across a map rather than reading it purely as a table of numbers.
How ECI, CEOs, and Districts Are Using GIS Today
State and district election machinery already draws on GIS-style thinking in a few well-documented ways, even where the tools involved are not Esri products specifically. The Meghalaya Chief Electoral Officer’s office, working with the North Eastern Space Applications Centre (NESAC), built one of the earliest state-level GIS applications for election management, launched in 2009. More recently, a 2024 case study on polling booth monitoring in Telangana documented how GIS and Artificial Intelligence (AI) based tools supported law enforcement coordination during that state’s elections.
At the national level, the ECI’s own digital ecosystem, spanning ENCORE, cVIGIL, ECINET, the Voter Helpline App, and the Suvidha Portal for candidate permissions, already gives officials location-relevant, real-time information without necessarily branding it as GIS. Vulnerability Mapping (VM) is a good example of this at the district level. It is the process district administrations use to classify polling stations as sensitive, critical, or vulnerable, based on past incidents, terrain, and communication access, and it already drives CAPF deployment and Micro-Observer placement. A shared GIS layer could make this classification process faster to update and cross-reference.
Challenges and the Road Ahead
Fragmented Systems Across Agencies
Election logistics currently sit across several separate ECI applications, state police systems, and district administration records rather than one unified location layer. A Sector Officer’s Vulnerability Mapping data, a CAPF deployment plan, and a webcasting monitoring feed are often maintained independently, which means cross-referencing them during a fast-moving polling day still depends heavily on phone calls and manual coordination rather than a shared map.
Connectivity in Remote and Difficult Terrain
Booths in the Gir forest, Himalayan hamlets, Naxal-affected districts of Bastar and Sukma, and river islands in Assam often have no reliable mobile network. This limits how much real-time data, such as webcasting feeds or live turnout updates, can actually reach a control room on polling day. Officials in these areas continue to rely on satellite phones, periodic data syncs once connectivity is regained, and physical courier of information where digital transmission is not possible.
Webcasting Reliability at Scale
Even where cameras are installed, internal ECI reviews after the 2024 Lok Sabha elections found that webcasting was non-functional for two to four hours at a stretch across several booths during some phases. Reaching the Commission’s own goal of comprehensive webcasting coverage will depend as much on equipment reliability and camera placement as on policy intent, since a live feed is only useful if it stays live through the hours that matter most.
Terrain-Specific Logistics for a Growing Electorate
As India’s registered voter base continues to grow, sustaining commitments such as the two-kilometer travel rule for every voter, including the sole resident of a forest hamlet, will require even more precise route and terrain planning. A location-based system that keeps polling station, road, and terrain data current between elections, rather than rebuilding it each cycle, would make this planning faster without changing the underlying commitment to reach every voter.
None of these challenges take away from what the Commission already manages successfully, election after election, at a scale most democracies never have to plan for. Strengthening the underlying location infrastructure is less about fixing something broken and more about giving officials a faster, clearer picture of what is happening on the ground. That applies at every level, from a Sector Officer in Bastar to a CEO’s control room in Delhi.
FAQs
1.How does the Election Commission of India manage large-scale elections?
The ECI manages large-scale elections by dividing the country into phases and constituencies, deploying District Election Officers, Returning Officers, and Sector Officers to specific areas, and coordinating security forces alongside them. Digital platforms such as ENCORE and cVIGIL support this coordination alongside established administrative and security protocols.
2.How does GIS help with EVM tracking?
GIS-style tools can support EVM chain-of-custody tracking by mapping the movement of EVMs from First Level Checking through dispatch centres to polling stations, and then to strong rooms for secure storage until counting. The ECI’s own EVM Tracking Software already handles randomization and allocation, and location-based tracking is a capability that could add a geographic layer to that existing process.
3.What is the cVIGIL app?
cVIGIL is the ECI’s citizen-facing app that lets any voter photograph or film a suspected Model Code of Conduct violation, with the app automatically geo-tagging the location. The Commission has committed to acting on and responding to each case within a 100-minute window.
4.How is webcasting of polling stations done?
Webcasting involves installing cameras at polling stations that stream to monitoring control rooms at the state, district, and constituency levels. Coverage has expanded over recent election cycles, moving from a focus on sensitive and critical booths toward a broader push for all polling stations with internet connectivity.
5.How does GIS support election day logistics?
GIS-style planning supports election day logistics by mapping polling party routes, vehicle deployment, and force positioning ahead of time, and by helping identify pinch points in remote or difficult terrain before polling day arrives. This planning complements, rather than replaces, the ECI’s existing administrative and security protocols for the day itself.
Written by
Esri India Marketing