Crop Type Classification
Crop type mapping is the technique that provides information on where different crops are grown across a region, making it an essential activity for agricultural monitoring. Crop maps help track changes in cropping patterns, manage over and under-production. Crop type mapping also plays a key role in improving food security, supporting rural development, and evaluating the impact of agricultural policies.
Why Transformer Models for Crop Type Classification
Traditional CNN based models have difficulty capturing crop texture in medium-resolution satellite images like Sentinel-2. Models such as RNNs and LSTMs also require high computational power, making them less suitable for large-scale use. To address these challenges, a state-of-the-art model, PSETAE, was developed for crop classification. PSETAE treats agricultural fields as objects instead of relying on pixel-level texture, and it effectively uses spatial, spectral and temporal information, making it more suitable for large-scale crop mapping tasks. For more information on PSETAE and how it works refer How PSETAE model works.
Data Preparation
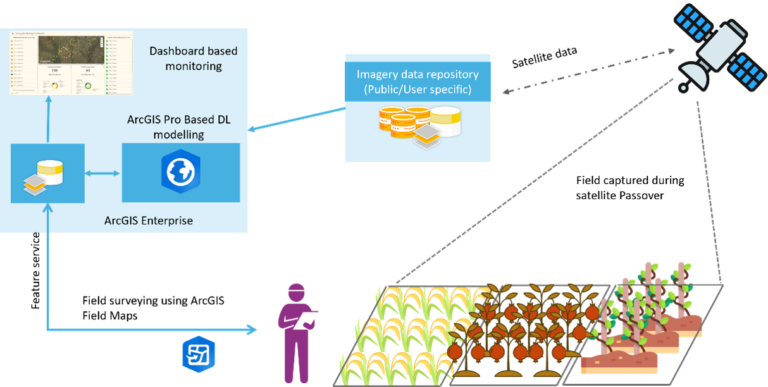
PSETAE model requires field polygon as input. These can either be collected using Label Objects for deep learning tool or by collecting data from field. We, in this blog, have used field verified data (data source link). The field verified data was collected using ArcGIS Field Maps and ArcGIS dashboard was used to monitor the field survey. Collected data has information such as crop types, field boundaries, and other ancillary data from the field. Figure 1 shows conceptual data collection workflow involving field work.
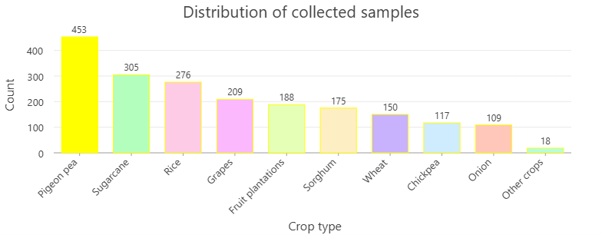
A subset, as shown in the below figure, of 2000 samples were then used for crop classification. Figure 1 shows asymmetric distribution of sample similar to the ground case in the surveyed area.
Sentienel-2 Temporal Mosaic Dataset
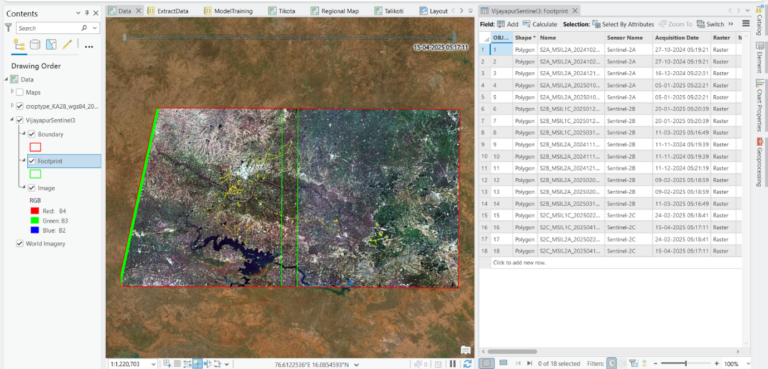
The input training data for crop classification is a multi-dimensional raster from the required time periods. Sentinel-2 (2A, 2B and 2C) satellite imagery time-series (SITS) data from October 2024 to April 2025 was used to create time aware multi-dimensional dataset for the area (here in case Vijayapura district of Karnataka). Following the workflow of Creating Mosaic dataset, .safe files from Sentinel-2 were added to the dataset and then a multi-dimensional information was built. Figure 3 shows the output of the multi-dimensional dataset.
PSETAE Implementation
The Figure 4 illustrates a three-step implementation of crop-type classification using a seamless plug-and-play workflow. It begins with Exporting Training Data for Deep Learning, followed by Model Training using the Train Deep Learning Model tool, and finally inferencing using the Classify Pixels Using Deep Learning tool to generate a detailed crop-type classification map.

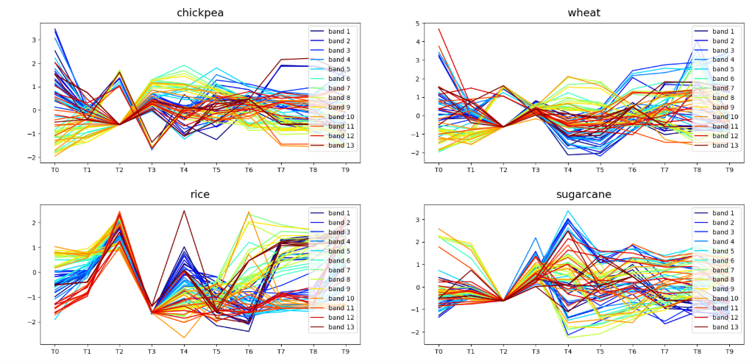
The Export Training Data for Deep Learning tool is used to export the raster chips in RCNN Masks metadata format. Tool generates folder structure and data in the format that is compatible with PSETAE model. The exported data then pre-processes raw satellite time-series into model-ready batches where temporal data is put to the fixed temporal sequence so that the model can understand spatio-temporal-spectral variations between the crops. Figure 5 shows how the model sees different crops over 9 time periods and 13 bands.
The processed data is then used to train the PSETAE model via Train Deep Learning Model tool. Model parameters are set based on the dataset characteristics, such as adjusting the batch size (32), dimensions of MLPs used, and drop rate (0.2), learning rate (0.001) and others. This is done to optimize the model’s ability to capture temporal patterns in the satellite time-series data for accurate crop type classification.
Model training, on 12 GB dedicated NVIDIA RTX 3500 GPU, took nearly 20 minutes to train PSETAE model for 25 epochs. PSETAE models quickly learn spatial-temporal and spectral patterns for each crop with F1 scores reaching as high as 0.94 for pigeonpea, 0.99 for wheat and 0.92 for sugarcane. Figure 6 shows the Per class metrics table containing F1 score for 9 crops including the crop specifically stated above. Such good F1 scores for a set of 10 crops is indication of better crop type classification model.

Subdistrict Crop Maps
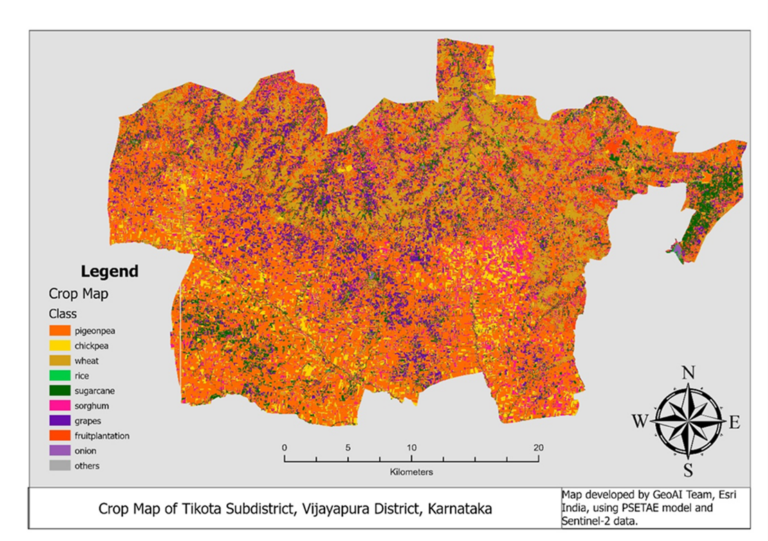
Generated model, a Deep Learning Package (.dlpk), would be then used to generate crop classification map using tool Classify Pixels Using Deep Learning. The tool will take Sentinel-2 SITS data and the model as inputs to do inferencing and generate classified Crop type map. We can run model on entire tile of Sentinel-2 SITS covering sub-districts and districts of the surveyed area. Figure 7 shows the sub-districts crop map for the Rabi season of 2024-25 for Tikota, Karnataka
What makes this workflow truly interesting is how Esri has seamlessly integrated this complex state-of-the-art transformer-based model (PSETAE) as tools-based workflow in ArcGIS Pro. This simple tool-based workflow makes crop-type classification more accessible and scalable to a point that every district could generate its own crop classification maps.
Conclusion
Building a crop type classification map at district level is the need of the hour. By combining open satellite imagery time series data, advanced transformer based GeoAI models, and ArcGIS-based data pipelines, it is now possible to generate reliable crop-type maps at district level. These district level crop-type map will play major role going forward in agricultural related planning, and project implementation. This will invariably strengthen resilience in agriculture at local level thereby building strong foundation for regional food security.
Reference
- How PSETAE model works. https://developers.arcgis.com/python/latest/guide/how-psetae-works/
- Satellite Image Time Series Classification With Pixel-Set Encoders and Temporal Self-Attention
- Data used: Yaragal, S. (2026). Field-Verified Crop Type Polygon Dataset for Rabi Season 2025 in Vijayapura District for Satellite-Based Crop Classification. Zenodo. https://doi.org/10.5281/zenodo.18881034

Shivaprakash, manager on the Presales team, designs India-specific GIS solutions for Esri India customers.