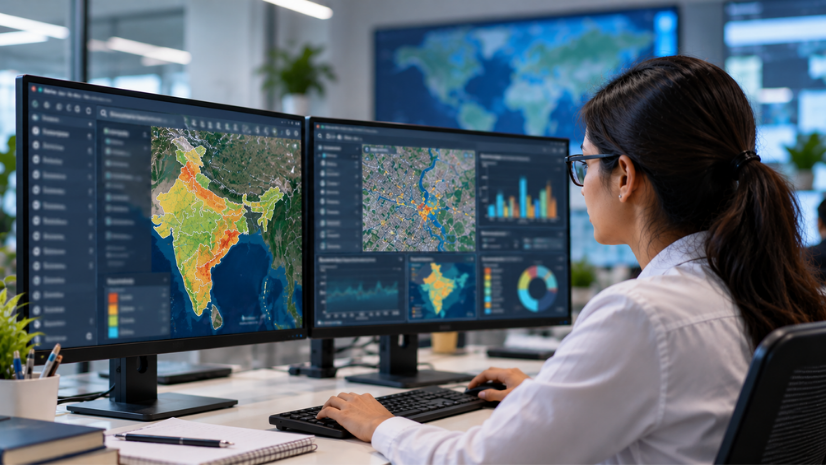
Supply chain visibility with GIS is the use of Geographic Information System (GIS) technology to map, monitor, and analyze every tier of a manufacturer’s supplier, logistics, and distribution network in a single spatial view. It connects supplier locations, transport corridors, climate hazards, and compliance data so procurement, operations, and risk teams can see disruptions before they turn into losses.
Why Supply Chains Are Now a Boardroom Topic in India
A cyclone off the east coast, a container backlog at a transhipment hub thousands of kilometres away, and a single-source supplier that goes quiet for a week: each of these has, in recent years, forced an Indian manufacturer to explain a production delay to its board. Supply chain risk used to sit inside procurement and logistics teams. It now sits on board agendas alongside capital allocation and market strategy, because a single disrupted node can cascade into missed production targets, penalty clauses, and reputational damage within days.
India’s manufacturing base has expanded fast under the Production Linked Incentive (PLI) scheme, Make in India, and the broader Aatmanirbhar Bharat push. Fourteen sectors, including electronics, semiconductors, pharmaceuticals, automotive, telecom, solar photovoltaics, drones, food processing, textiles, white goods, and specialty steel, now carry incentive-linked production targets. Every one of those targets depends on a supply chain that can be seen, measured, and defended against disruption, and that dependency only grows as production volumes scale up to meet PLI milestones. That is where GIS enters the conversation.
The stakes are compounded by how young much of this manufacturing capacity is. A factory commissioned in the last three years under a PLI scheme has not yet lived through a full cycle of monsoon flooding, port congestion, and supplier consolidation, which means many of its risk exposures are still theoretical rather than tested. Spatial risk mapping lets a manufacturer stress-test those exposures on a map before they show up as a missed shipment.
What Is Supply Chain Visibility with GIS?
Supply chain visibility with GIS combines supplier location data, transport network data, climate hazard layers, and compliance records on a single spatially referenced platform. Rather than tracking suppliers as rows in a spreadsheet, a manufacturer sees them as points and paths on a map, connected to ports, highways, warehouses, and raw material sources.
This spatial view answers questions a spreadsheet cannot. Which suppliers sit inside a flood-prone river basin? Which raw material sources depend on a single port that could face a strike or a storm? Which tier-2 and tier-3 suppliers, the ones a manufacturer rarely audits directly, feed into a critical component line? GIS makes these questions answerable in minutes rather than weeks.
The shift also changes who gets to ask these questions. A spreadsheet-based supplier list typically lives with procurement and is rarely opened by risk, sustainability, or logistics teams working the same problem from different angles. A shared spatial platform puts everyone on the same map, which turns supply chain risk from a siloed procurement exercise into a cross-functional one.
India’s Manufacturing Moment: PLI, Make in India, and China+1
India’s manufacturing clusters are not evenly distributed, and that unevenness is itself a strategic signal. Pune-Chakan anchors automotive component manufacturing. Chennai-Sriperumbudur has become an electronics and auto hub. Hyderabad’s Genome Valley concentrates pharmaceutical and life sciences production. Gujarat’s Sanand and Dahej corridor, Andhra Pradesh’s Sri City, and Bengaluru’s aerospace and engineering research and development belt each carry a distinct industrial identity.
Cluster-level site selection is where GIS adds the most immediate value for global brands evaluating India under a China+1 diversification strategy. Companies weighing Indian assembly operations look at cluster ecosystem maturity, port access, power reliability, and skilled labour availability, exactly the layered analysis that spatial tools are built for. Semicon India and the India Semiconductor Mission add another dimension to this picture, since semiconductor fabrication and assembly-testing-marking-packaging (ATMP) units depend on an even narrower set of site criteria: ultra-reliable power, high-purity water access, and proximity to specialty gas and chemical suppliers.
Government coordination across the Department for Promotion of Industry and Internal Trade (DPIIT), the Ministry of Electronics and Information Technology (MeitY), the Ministry of Commerce, and the Ministry of Heavy Industries now increasingly relies on geospatial data to track PLI-linked capacity build-out against the clusters it is meant to activate. This coordination matters for manufacturers too, since incentive disbursement is often tied to verified production milestones, and spatial data offers a defensible way to demonstrate that a facility and its supporting supplier base are where they are supposed to be.
How GIS Maps the Entire Supply Chain: Upstream to Last Mile
A finished product’s supply chain rarely stops at the factory gate, and the biggest blind spot for most manufacturers sits several tiers upstream. Tier-1 suppliers are usually well documented. Tier-2 and tier-3 suppliers, where raw materials, critical minerals, and key starting materials for pharmaceutical Active Pharmaceutical Ingredients (APIs) originate, are frequently invisible to the manufacturer that ultimately depends on them.
Tier-3 visibility is the newest frontier in supply chain mapping. By combining satellite imagery, supplier self-reported location data, and field survey tools, manufacturers can build a verified map of raw material origins, whether that is a cotton-growing district, a mineral concession, or a semiconductor wafer fabrication site, that was previously documented only on paper.
This is also where India’s Critical Minerals Mission enters the picture: lithium, cobalt, nickel, and rare earth element sourcing from Australia, Argentina, Chile, and the Democratic Republic of Congo, alongside domestic exploration sites such as the Reasi lithium find in Jammu and Kashmir and the pegmatite belt of the Bastar Craton in Chhattisgarh, sits at exactly this upstream tier. Electric vehicle, battery, and electronics manufacturers under the PLI scheme are exposed to this geography whether they track it or not.
Last-mile and distribution mapping uses tools like ArcGIS Network Analyst to model realistic drive times, route options, and warehouse coverage areas across India’s road and rail network. This turns distribution planning from a straight-line-distance estimate into a routing-aware, congestion-aware model, which matters in a country where the fastest route on paper is rarely the fastest route on the ground. The rise of Open Network for Digital Commerce (ONDC) style logistics interoperability adds another layer to this picture, since manufacturers increasingly need to plan distribution against a more fragmented, multi-carrier last-mile network rather than a single dedicated fleet.
Digital twin modelling brings these layers together into a live representation of the physical supply chain. A digital twin of a manufacturer’s supplier and logistics network lets planners simulate the impact of a plant shutdown or a port closure before it happens, rather than reacting once it does, and lets them test multiple contingency plans side by side instead of committing to the first workaround that comes to mind.
Risk Layers: Climate, Geopolitical, Operational, Compliance
Modern supply chain risk in India stacks across at least four layers, and treating them separately is how blind spots form.
Climate risk is no longer a once-a-decade concern. Chennai’s floods in 2015 and again in late 2023, recurring monsoon disruption in Mumbai, and rising cyclone frequency along the east coast all demonstrate how a single climate event can halt production and logistics simultaneously. GIS overlays factory footprints, supplier sites, and logistics nodes against flood zones, cyclone tracks, and heat stress data to flag exposure before the monsoon arrives, not after.
Geopolitical risk now runs through chokepoints far from Indian shores. Disruption in the Red Sea, the Strait of Hormuz, or the Taiwan Strait can idle Indian factories dependent on imported components. Route resilience planning, comparing Jawaharlal Nehru Port Authority (JNPA) against Mundra, or evaluating fast-scaling transhipment hubs like Vizhinjam and Vallarpadam, gives logistics teams pre-modelled alternatives rather than a scramble when a corridor closes.
Operational risk includes factors that rarely show up on a standard supplier scorecard, such as a supplier’s financial health or exposure to a cyberattack that could take its systems offline for weeks. A spatial view does not replace financial due diligence, but it does show whether several financially fragile suppliers sit inside the same district or depend on the same single road link, which turns an isolated operational worry into a concentrated geographic one.
Compliance risk increasingly includes sustainability disclosure. The Securities and Exchange Board of India’s (SEBI) Business Responsibility and Sustainability Reporting (BRSR) Core framework requires listed companies to report value-chain emissions and supplier-level Environmental, Social, and Governance (ESG) data. Spatial dashboards that aggregate supplier sustainability profiles, water-stress overlays, and biodiversity exposure across multi-tier networks turn a compliance burden into a structured, auditable dataset, which matters because BRSR Core reporting increasingly extends beyond a company’s own operations into its supply chain.
Building Resilience: Scenario Modelling and Dual Sourcing
Visibility on its own does not build resilience; it has to feed decisions. Scenario modelling lets a manufacturer ask “what if” before a disruption forces the answer: what happens to output if a single supplier cluster in one state is knocked out for two weeks, and which alternate sourcing geography absorbs that gap fastest.
Dual and multi-sourcing strategy depends on knowing, with confidence, where a second supplier actually sits relative to the same climate and geopolitical risks as the first. A backup supplier in the same flood basin or dependent on the same port is not meaningfully diversified, even if it appears as a separate line item in a procurement system. GIS-based analysis for large, multi-source datasets makes that comparison explicit rather than assumed, and can flag hidden concentration even across suppliers that a procurement team has always treated as independent.
This kind of scenario planning works best when it is grounded in real infrastructure data rather than static maps. India’s National Logistics Policy 2022 and the PM Gati Shakti National Master Plan, together with the Unified Logistics Interface Platform (ULIP), now aggregate data from ports, railways, roadways, and customs into a shared digital layer. A resilience model that plugs into this same geospatial fabric can align dual-sourcing and warehouse decisions with real infrastructure investment plans, including how Special Economic Zones (SEZs) and Free Trade Warehousing Zones (FTWZs) connect into the evolving logistics grid, rather than working from assumptions that lag behind new highways or port expansions.
Resilience planning also has a financial dimension that scenario modelling makes visible. Dual sourcing typically costs more per unit than single sourcing, and manufacturers need a defensible way to decide which suppliers are worth that premium. Mapping supplier concentration against actual disruption history and hazard exposure gives risk and procurement teams a shared, evidence-based basis for that trade-off, rather than a decision made on instinct or on whichever supplier happens to be easiest to onboard.
How Indian Manufacturers Are Adopting GIS in Their Supply Chain
Adoption today tends to follow the maturity of a manufacturer’s existing GIS footprint rather than a single industry-wide pattern. Mining and natural resources companies such as Tata Steel have already applied ArcGIS Pro alongside GeoAI capabilities to environmental and operational monitoring, a foundation that extends naturally into upstream supply mapping since much of that monitoring already tracks raw material sites and haulage routes.
Ports and logistics infrastructure operators, including Jawaharlal Nehru Port Authority (JNPA) and Adani Ports & SEZ (APSEZ), have built GIS-based frameworks to map and manage port and township infrastructure, the same spatial backbone that supply chain visibility platforms depend on for last-mile and port-side planning.
Telecom infrastructure rollout, as seen in Jio’s nationwide network deployment mapping, demonstrates how the same location intelligence used for infrastructure build-out applies just as well to tracking distributed supplier and logistics networks. In agriculture-linked supply chains, the Haryana Space Applications Centre’s (HARSAC) use of GIS for crop management shows a parallel pattern: satellite and spatial data turning a traditionally paper-based, field-level activity into something a central team can monitor and plan against, which is precisely the shift textile and food processing manufacturers need for tier-3 raw material visibility.
Live operational dashboards let control tower teams monitor supplier status, shipment movement, and risk alerts on a single screen, while site-selection and market-access analysis tools underpin where new plants and warehouses should go in the first place. Indo ArcGIS Living Atlas provides the India-specific administrative, infrastructure, and demographic layers that make this analysis usable out of the box rather than built from scratch, which shortens the time between deciding to build a visibility programme and actually having a usable map.
Challenges and the Road Ahead
The opportunity is real, but several frictions stand between most manufacturers and full supply chain visibility, and none of them get solved by buying software alone.
Data fragmentation across systems
Enterprise Resource Planning (ERP) systems, supplier portals, customs data, and logistics tracking tools rarely speak to each other through standard Application Programming Interfaces (APIs). A procurement team may know a supplier’s payment terms in exquisite detail while having no idea that the same supplier’s only factory sits inside a district flagged for flood risk. Until these systems are integrated, location intelligence stays trapped inside whichever team commissioned it instead of reaching the staff who make daily sourcing calls.
Tier-3 supplier reluctance
Smaller raw material suppliers often run on paper records and have little incentive to share precise location, capacity, or ownership data with a manufacturer several tiers removed from them. This friction slows visibility efforts at exactly the point where risk concentrates most. Closing this gap tends to require field surveys, local outreach, and a value exchange, such as offering suppliers better demand forecasting in return for better location data, since a mandate alone rarely produces reliable disclosure.
Scarce cross-disciplinary talent
Most supply chain teams understand sourcing and logistics deeply but have limited exposure to spatial analysis, while most GIS specialists have limited exposure to procurement economics. Building a team fluent in both takes sustained investment in training and cross-functional hiring, not a one-time software purchase, and the manufacturers furthest along tend to be the ones who invested in this talent gap two or three years before their competitors noticed it existed.
Missing data standardisation
Individual manufacturers build their own flood, cyclone, and heat-stress overlays from whatever data source is convenient, making it difficult to benchmark exposure across an industry for BRSR Core disclosure. A shared, authoritative set of climate and infrastructure layers would let every manufacturer work from the same baseline instead of reinventing it independently.
Leadership buy-in gaps
Supply chain visibility programmes often start as a risk or sustainability initiative, which means they compete for budget against functions with more immediate, measurable returns. This is a quieter but persistent obstacle. The manufacturers who move past pilot projects tend to be the ones who can tie visibility directly to a boardroom concern, such as PLI milestone risk or BRSR Core exposure, rather than pitching it purely as a risk management nicety.
Real-time integration ahead
Platforms like ArcGIS Velocity can stream live shipment, weather, and sensor data into the same spatial view used for strategic planning, closing the gap between an annual risk assessment and the daily reality of a shipment stuck at a port. The manufacturers moving fastest are the ones treating supply chain visibility as a living operational discipline rather than a slide deck refreshed once a year.
Manufacturing resilience is not really a technology problem. It is a visibility problem wearing a technology solution. Every unmapped tier-3 supplier, every single-sourced critical mineral, every factory sitting quietly inside a flood plain, is a decision waiting to be made with better information. The manufacturers that build that visibility now, tier by tier and risk layer by risk layer, will be the ones still shipping on time when the next disruption arrives.
FAQs
1.What is supply chain visibility with GIS?
It is the use of GIS technology to map and monitor suppliers, logistics routes, and distribution networks on a single spatial platform, so manufacturers can see exactly where risk clusters geographically.
2.How can GIS help build supply chain resilience?
GIS enables scenario modelling that shows how a disruption at one supplier or port would ripple through the network before it happens, and verifies that backup suppliers are genuinely diversified rather than exposed to the same underlying risks.
3.What are the major supply chain risks for Indian manufacturers?
The main risk layers are climate events like floods and cyclones, geopolitical disruption at global shipping chokepoints such as the Red Sea and Strait of Hormuz, operational risks like supplier financial health and cyber exposure, and compliance requirements such as BRSR Core reporting.
4.How does the PLI scheme connect to supply chain mapping?
The PLI scheme’s 14 sectors are anchored in specific manufacturing clusters across India, from Pune-Chakan to Sriperumbudur to Hyderabad’s Genome Valley. Supply chain mapping helps track whether supplier and infrastructure capacity is keeping pace with these clusters’ production targets.
5.What is tier-3 supplier visibility?
Tier-3 visibility means mapping the raw material sources furthest upstream in a supply chain, such as mineral sites or cotton-growing regions. These origins are the least documented tier for most manufacturers and often carry the highest concentration risk.
Written by
Esri India Marketing