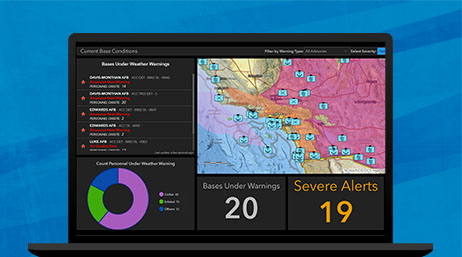
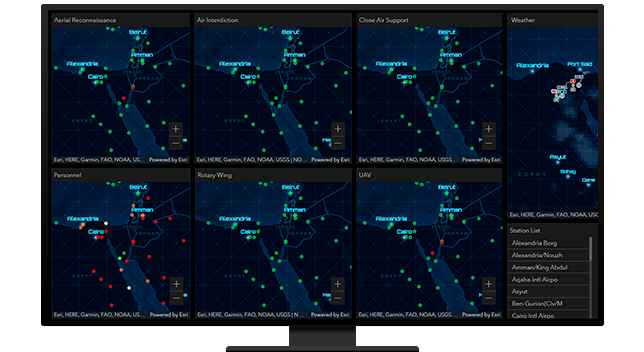
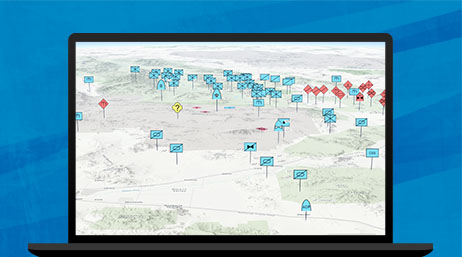
ArcGIS Dashboards
Present location-based analytics with interactive data visualizations on a single screen.


Commanders and staff use GIS to develop and maintain a comprehensive view of the operational environment. Staff are able to integrate information across all domains and collate input from all disciplines and functions. The operational environment is dynamic and impacted by complex factors that leaders can visualize and analyze throughout all phases of an operation.
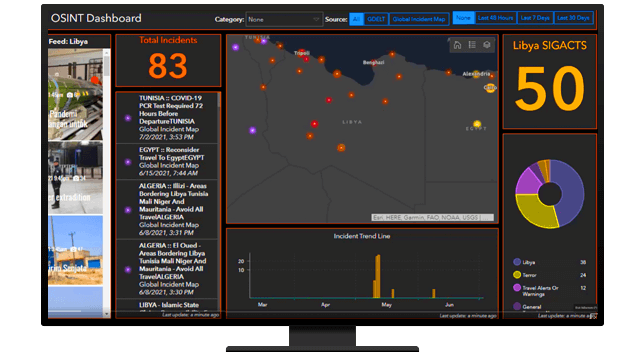
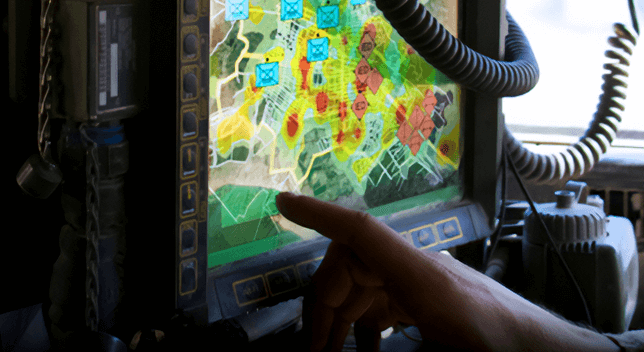
ArcGIS provides a real-time environment to integrate, fuse, and exploit data from sensors. Staff can create rules and alerts dynamically, integrating Intelligence, Surveillance and Reconnaissance (ISR) collection with plans and control measures.
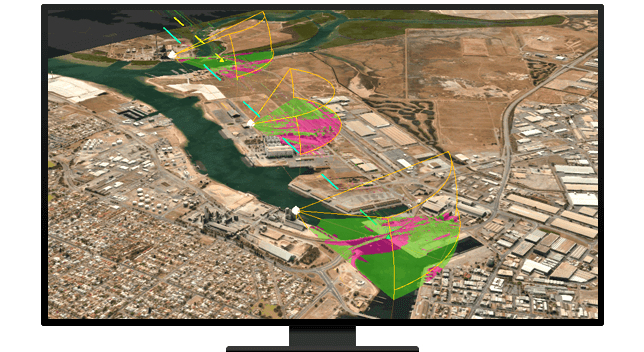
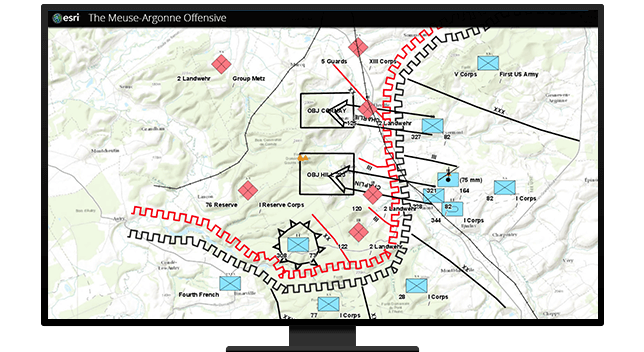
ArcGIS delivers a geographic framework for the military decision-making and intelligence preparation processes. Military staff can use collaboration tools to integrate data from multiple staff functions into a dynamic information environment supporting all phases of an operation, including both friendly and enemy course of action analysis.
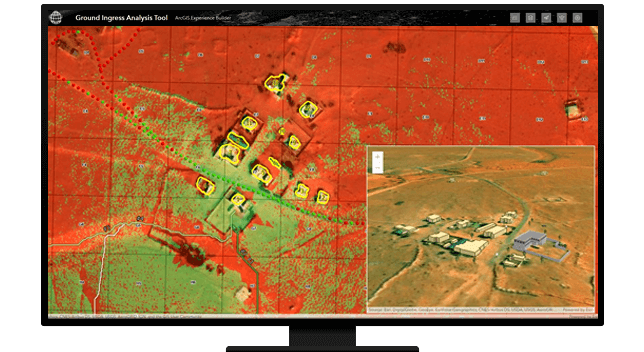
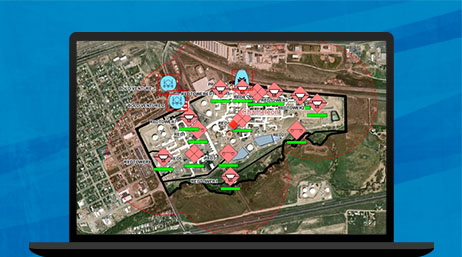
Military staff use ArcGIS as a framework for understanding the distribution of forces and operating areas for offensive and defensive operations. ArcGIS delivers near real-time situational understanding to enable timely emergency management and crisis response. ArcGIS enhances logistics management and operations, providing valuable insights into supply levels, supply management, and transshipment execution across all phases of an operation or campaign. Forces can employ mission control tools to communicate status and task assignment.
Use GIS as a foundation for command and control, and its tools to deliver the operational vision, guidance, and direction to synchronize mission activities across the command staff. User-defined views of data allow each staff function to gain a clear understanding of operational data. Triggers and alerts help to connect current operations to planning. Collaboration tools help communicate plans and decisions.
ArcGIS is an enterprise platform that organizations can integrate into maneuver systems to achieve tactical success and execute strategic objectives and desired effects. ArcGIS is interoperable and provides a modern IT framework for supporting an agile enterprise. Deploy ArcGIS in many computing environments and support all types of echelons, from tactical to operational and strategic levels.
ArcGIS Dashboards
ArcGIS GeoEvent Server
Military Symbology
Please fill out your details below for us to contact you for the demo.
Write to us at info@esri.in
Talk to us over the phone