CUSTOMER SPEAK

Building a Climate Resilient Bihar with GIS

flood image

Elevating the Standard

In a conversation with Dr. CN Prabhu, Joint Director, Technical, Bihar Mausam Seva Kendra, a center under the Planning and Development Department, Government of Bihar, we explored the use of GIS in weather data visualization, prediction, and real-time decision support.

Dr. CN Prabhu, Joint Director, Technical, Bihar Mausam Seva Kendra image

What is the mission of Bihar Mausam Seva Kendra?

The climate is changing very rapidly and will continue to do so in the future. The mission of our organization is to take weather information and advisories to the end-users in a simple and comprehensible manner. 


How are you using GIS to manage changes in weather conditions?

Currently, we are using Esri’s ArcGIS along with other available tools. With all the data that is coming through our research, we are using various geospatial technologies to process and create products out of these datasets. The weather information and data are spread across many regions and are available at different spatial resolutions. This makes data collection slightly complex. We always try to collect the data at the finest resolution possible. Then, the GIS technology helps us in analyzing the data and giving us a replica of the ground. The data captured in the form of tables or graphs are not of any use to us since they do not provide a spatial perspective. However, if that map is interactive and has some tools to scan the data in multiple ways, it becomes more beneficial for us.

Given the nature of our job, we cannot limit ourselves to one particular region and analyze the data we receive from there alone. The neighbouring regions are equally important. Unless we visualize what is happening in that area on a geographical platform, it’s difficult to get a hold of the weather data. To manage the change in weather conditions, the collection, processing, and visualization of data in a customized way is important. This is where we use GIS.


How are you procuring the data for weather forecasting?

Our organization does not physically procure the data. Instead, we have installed a set of sensors at different geographical layers from where we collect the ground data. To be precise, we have a rain gauge in Bihar every three square kilometers, and in every 150 square kilometers, we have a weather station. The disparity between the weather station and rain gauge system is because weather conditions do not change as much as rainfall. So we have put up the weather sensors at the block level, and the rain gauge sensors at the panchayat level. 

We directly take the data coming through these stations into our server through the GPRS network with other very high temporal resolutions. We collect the data every 15 minutes. For other data like remote sensing, we have collaborated with ISRO. We also collaborate with private companies, when needed, for developing tools on the GIS platform for analysis, developing custom dashboards, or creating a GIS-based application. Apart from these, most of the things we do with in-house capacity. We have scientists, and engineers that carry out these tasks in our team of about 10-15 people, doing for the entire state.


Climate change is a burning issue right now and Bihar has faced inundation for many years. Are you using geospatial data to manage the situation better?

Until recently, we had a very limited number of sensors to monitor the rain gauge. Now, with the government of Bihar investing resources and money into it, we’ve grown to have more sensors at the panchayat level. This gives us a clear picture of the place, intensity, and amount of rainfall at any given place.

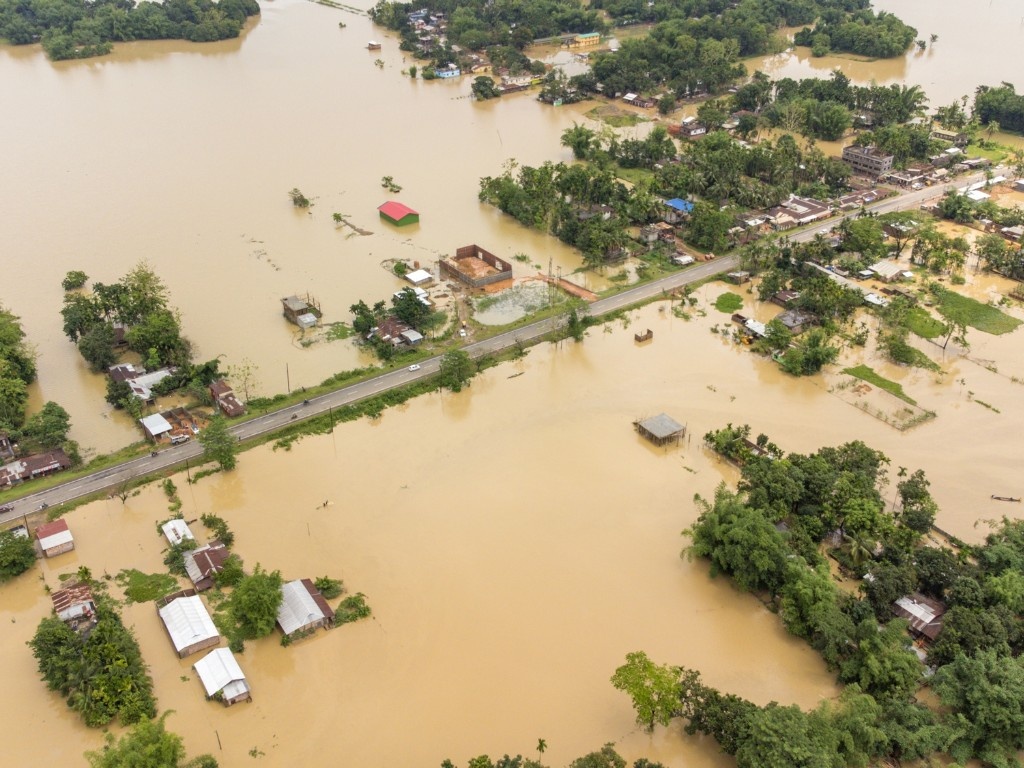
With this information only, we are managing the flood situation in Bihar. There are different sources of water, one is water coming through river channels, streams from outside, or rainfall. Unless we measure both of them properly, we will not be able to manage the flood properly. So we are measuring the rainfall at a very fine scale, and the water coming from outside is also being measured as well as what will be the cumulative effect at any point of place down the stream. This data is fed to the GIS platform, from where we can see where it is raining and with what intensity. When the intensity is increasing, we can calculate what would be the surface runoff, depending on the land use pattern there, and whether that can lead to flood or inundation in that area. Or if not there, down the line, along this stream, anywhere in the banks.

With a lot of lead time, we will be able to caution thedownstream people. By looking at what is happening upstream, we will be able to caution the downstream when and how it is approaching. We are trying to do this in Bihar at the moment, which is going to bring a lot of change in flood management in Bihar.


To download the PDF version of this article, click the button below.

Download PDF

Read More Articles

  • MCD Achieves Effective Governance with ArcGIS

    GIS Mapping a Better Future

    GIS provides a platform to store, manage, and analyze geospatial data to help make informed decisions in a variety of fields.

  • Enabling Suez to Achieve Optimum Efficiency in Water Projects

    Enabling Suez to Achieve Optimum Efficiency in Water Projects

    Suez Group has been active in the Indian water and wastewater market since 1978 and established an Indian subsidiary in 1986. Suez uses Esri products to enable comprehensive study and planning through GIS mapping, field surveys, and door-to-door surveys.

  • Empowering People with Mental  Disabilities like Autism with Help of GIS

    Empowering People with Mental Disabilities like Autism using GIS

    Mental disabilities encompass a spectrum of conditions affecting cognitive, emotional, and behavioral functions, impacting millions of children worldwide each year.

Previous
Next