Tree inventories in urban areas help us define a baseline for monitoring progress towards our green goals and identify opportunities for increasing tree cover. Automated tree inventories can help us monitor green cover in our cities frequently and reduce the man hours that go into traditional inventories such as field survey or manually digitizing using imagery.
How can I do it faster?
If you would like to do a quick detection of trees in your neighborhood, you can try Tree detection model, a pre-trained model, made available for us in the ArcGIS Living Atlas of the World.
Can I create a model from scratch to fit my geography?
Yes, you can train your own tree detection model or fine-tune the pre-train models and automate the tree count using Deep Learning tools in ArcGIS. There are multiple ways to do it – with ArcGIS Pro Image Analyst, or ArcGIS Enterprise with ArcGIS Image Server (Raster Analytics) or ArcGIS Online with ArcGIS Image for ArcGIS Online.
Here, I will be using ArcGIS Pro with Image Analyst to achieve three of my objectives – 1. How many trees are there in Noida? 2. Can I get a breakdown of tree count based on canopy size? 3. Which sector has the least tree density?
Let’s begin!
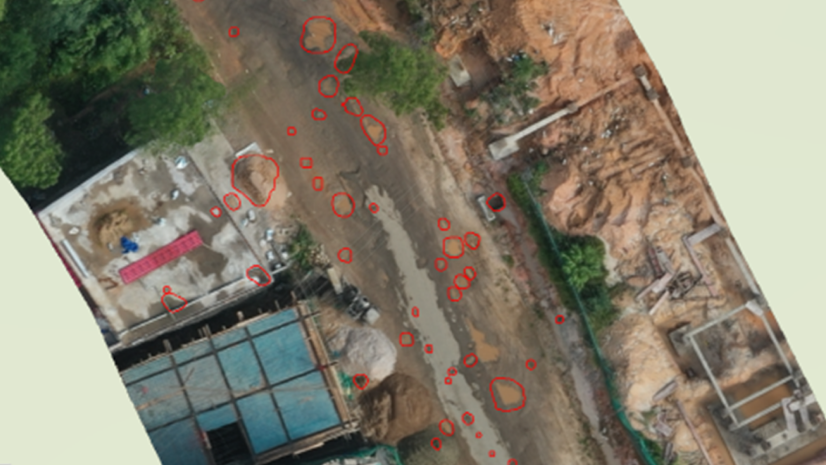
The first step is to Label the feature of interest – “trees”. You can use the Label Objects for Deep Learning pane or the Training Samples Manager to create training samples.

Next step is to export the training data in the right format. ArcGIS can export your data in several formats such as KITTI Labels, RCNN Masks, PASCAL Visual Object Classes, etc which will enable you to train several models like MaskRCNN, FasterRCNN, DETReg, etc. Check out this link to get an overview of deep learning models types and supported metadata. Here I will be exporting the data as PASCAL Visual Object Classes to train the FasterRCNN model as it has better detections than its contemporaries RCNN and FastRCNN. Now model can be trained using the “Train Deep Learning Model” geoprocessing tool. The output from this tool can be used in “Detect Objects Using Deep Learning” to detect trees in the input high-resolution imagery.
-
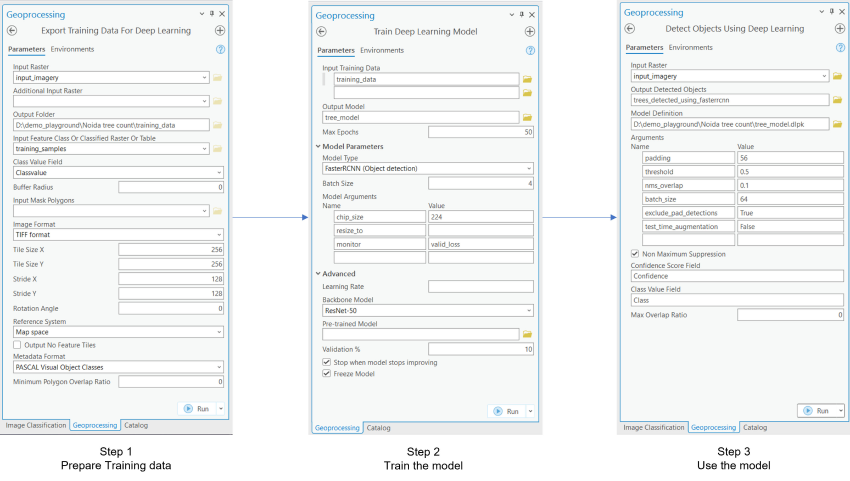
Deep learning workflow
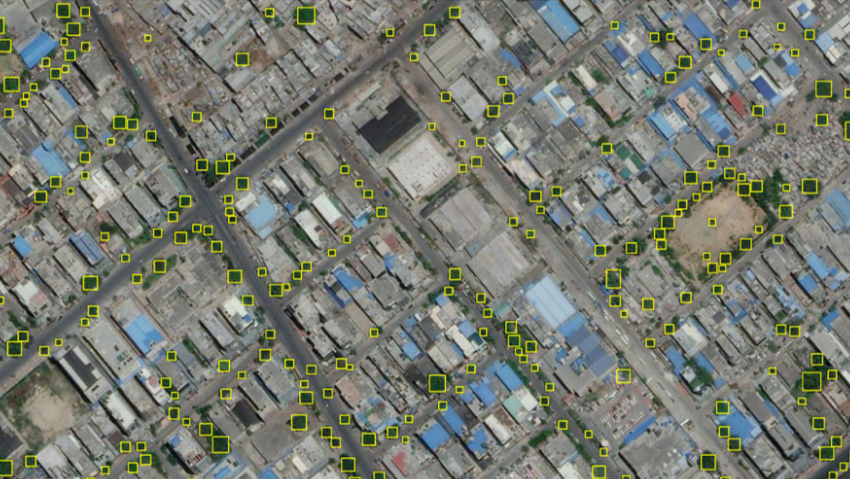
On average, it takes one hour to manually digitize 400 trees (i.e., 400 trees per hour), whereas the model was able to detect 1,37,224 trees in 158 minutes (i.e., 52000 trees per hour).
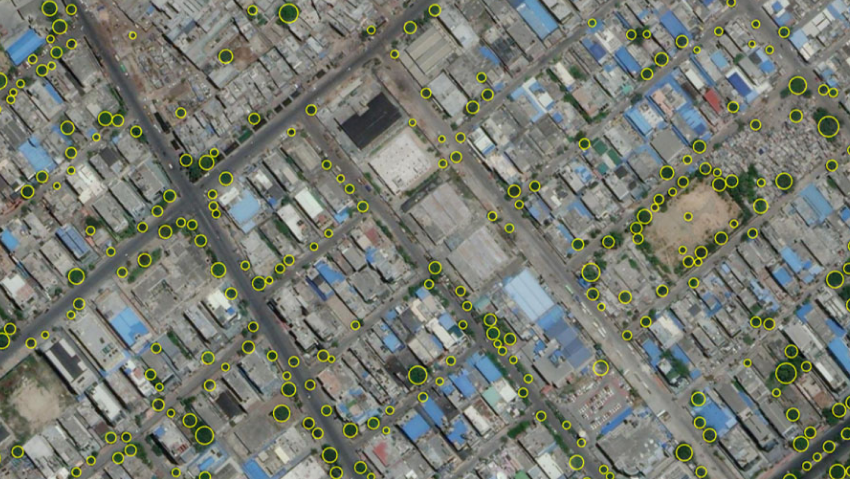
Using arcade expressions, you can convert the bounding boxes around the trees to get the tree canopies. This can help us sub-classify the trees as large, medium, and small trees based on their canopy cover area.
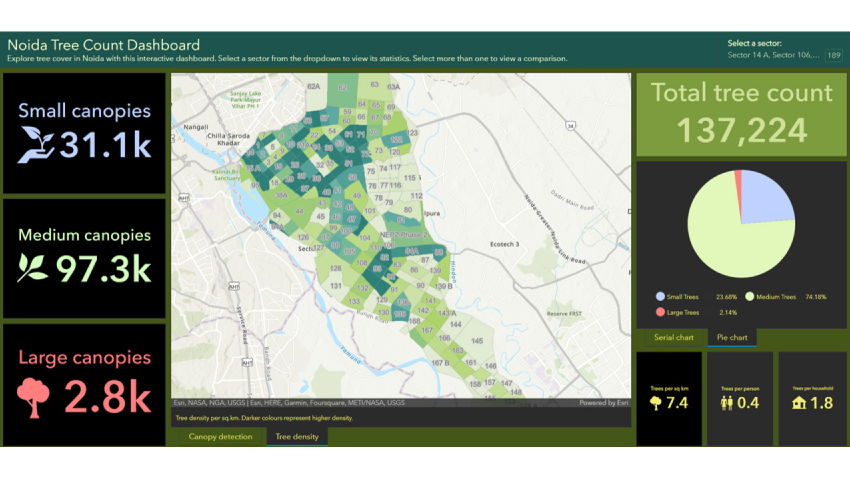
With ArcGIS Dashboards we can visualize the distribution of trees in Sectors of Noida. You can also enrich the data Esri GeoEnrichment Service from ArcGIS to get statistics such as trees per sq.km, Trees per person and trees per household.
-
Tree Density
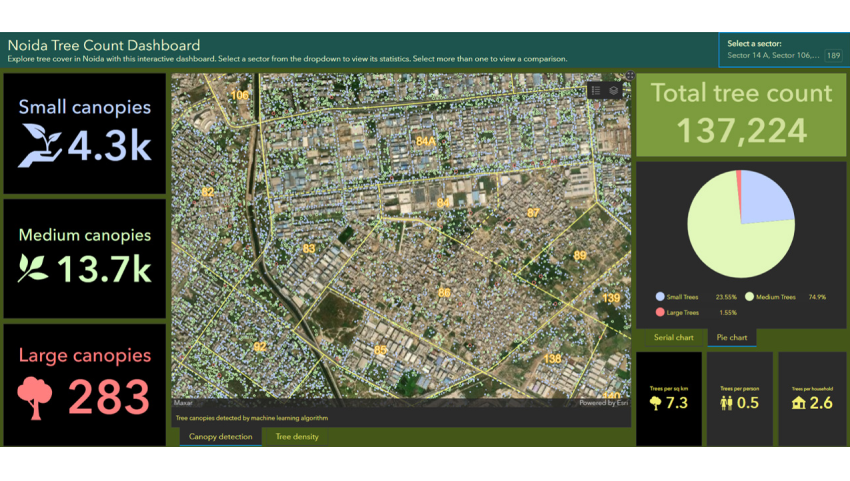
With ArcGIS Pro Image Analyst Deep Learning tools, I was able to achieve all my objectives. Now I have the count of trees (~137224), their sub-classification based on canopy size and well as Tree density map which will help me identify areas of low tree density for Sectors of Noida.
Additional resources
See the following links for more information regarding deep learning tools in ArcGIS:

I am an Assistant Manager on the Presales team focused on helping users better understand GeoAI in ArcGIS.

I am an engineer in the data science team, interested in the application and scope of AI and NLP in GIS.