The upcoming update of ArcGIS Business Analyst Web App, scheduled for release on October 22, 2025, introduces several key enhancements. These include new functionality to analyze nearby locations, more accurate credit estimation, and flexible benchmarking tools for smarter site comparisons. Additionally, the Results pane now features an enhanced histogram tab to support more effective mapping and analysis workflows. The release brings significant improvements to the Points of Interest (POI) dataset, with the addition of new categories and subcategories.
Data Updates: Points of Interest (PoI)
The inclusion of over fifty new categories and subcategories in the Esri India POI dataset, such as Schools, Colleges or Universities, Places of Worship, Residential Accommodations, Government Offices, Tourist Attractions, and Police Stations, will significantly enhance decision-making across various sectors. Here’s how:
- Enhanced Site Selection: Organizations will now be able to identify optimal locations for new facilities (e.g., retail stores, hospitals, or service centers) by analyzing proximity to relevant POIs like schools, residential areas, or government offices.
- Improved Accessibility Analysis: Urban planners and transportation agencies will now be able to easily assess how accessible key services (like police stations or educational institutions) are to different communities. This will help them to prioritize infrastructure development.
- Market and Customer Insights: Businesses will now be able to better understand the demographics and behavior of potential customers by analyzing nearby POIs, e.g., a café near colleges may cater to students, while one near offices may serve professionals.
- Emergency and Safety Planning: Knowing the locations of police stations, hospitals, and government offices will significantly help in planning emergency response strategies and ensuring public safety.
- Tourism and Cultural Planning: Tourism departments will now be able to use POI data to map and promote important attractions, plan guided routes, and improve visitor experiences.
- Real Estate Valuation: Real estate developers and investors will now be able to better assess property value based on proximity to amenities like schools, parks, and public services.
Mapping and Analysis Workflow Enhancements
New nearby analysis workflow: smarter insights from surrounding POIs
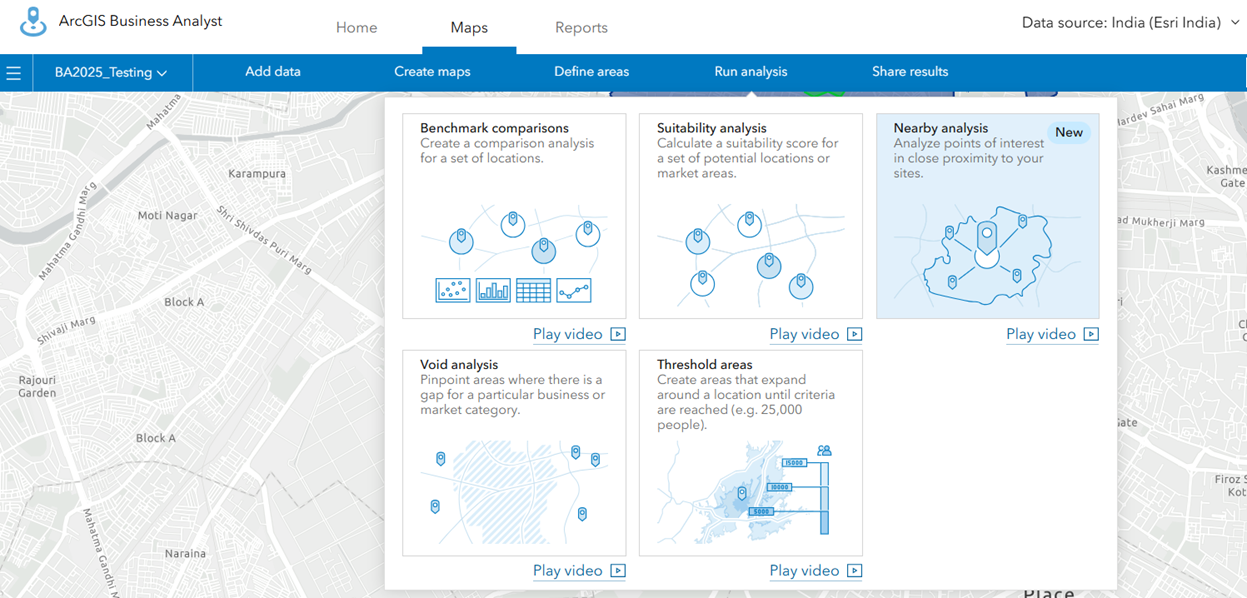
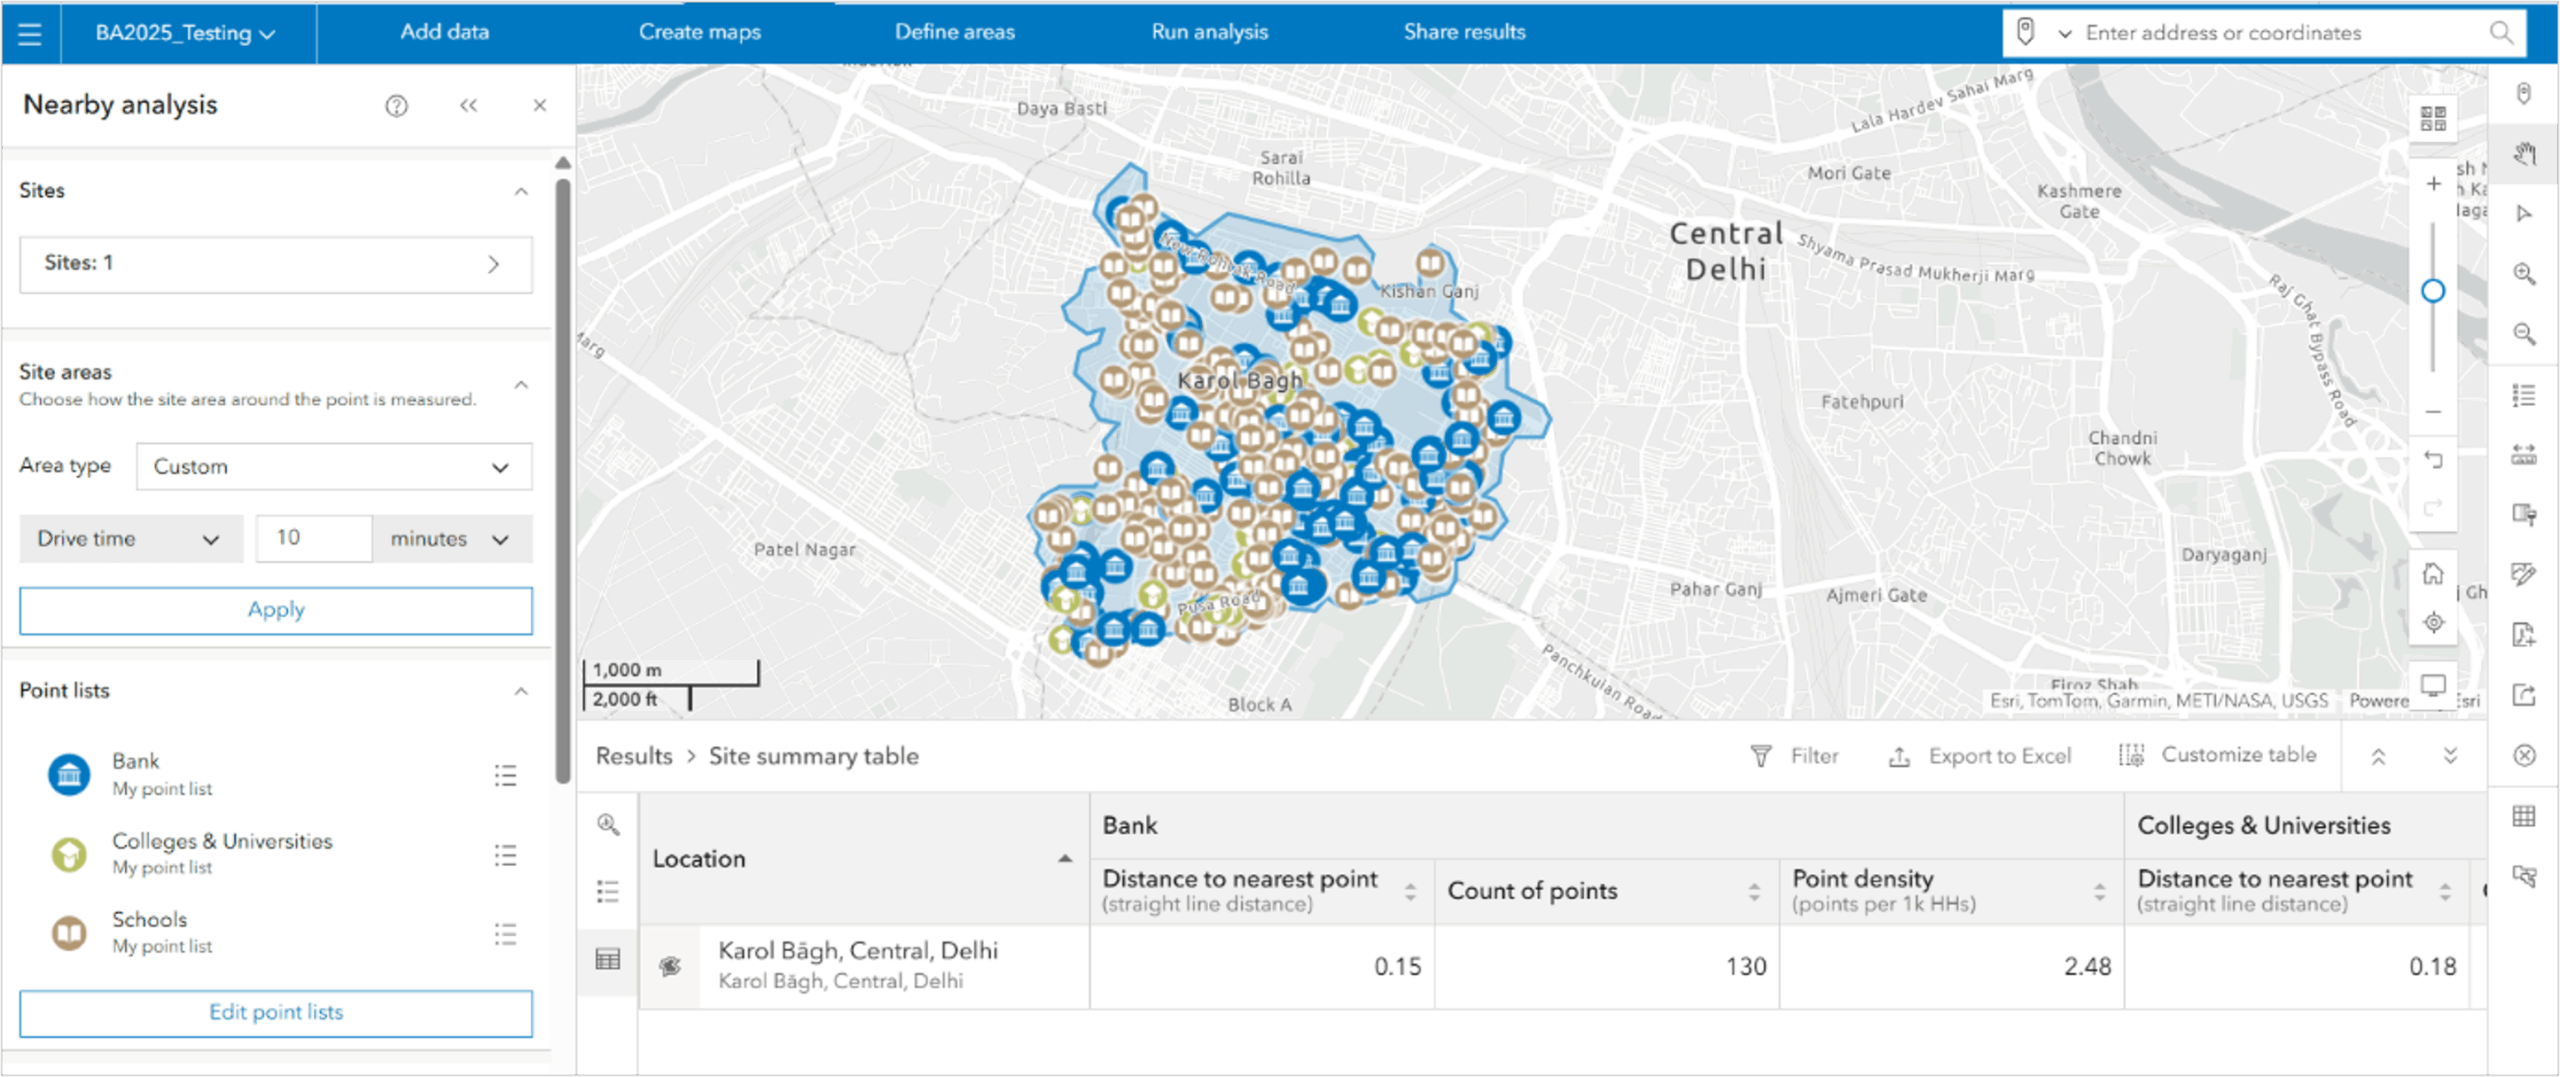
This release continues development efforts to support enhanced analysis capabilities for points of interest (POIs). It introduces a powerful new Advanced analysis workflow known as “Nearby Analysis”, designed to help users understand what places and POIs are within walking or driving distance of their sites. It applies to competitive analysis in retail, real estate, and restaurants, providing an instant snapshot of who is in the market and how close those competitors are. In health care, it will help in understanding service delivery and network adequacy. You can also bring customers, clients, patients, or any other point layer into the analysis to discover relationships and interactions between different categories of places, brands, consumers, or competition.
To access the tool, go to the Maps tab, click Run Analysis, and then select Nearby Analysis. This will open the Nearby Analysis pane.

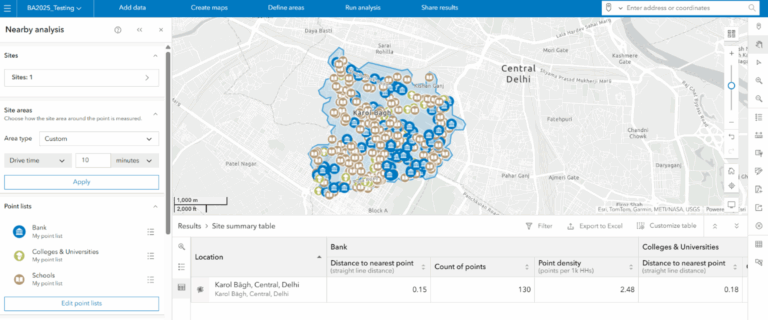
The analysis summarizes key statistics such as the number of points by type and distance, and points per 1,000 households. This insight is invaluable across industries:
- Public Sector: locating areas lacking access to services like food, education, or health care.
- Retail and Commercial Real Estate: identifying neighboring competitors and complementary businesses.
- Residential Real Estate: assessing quality of life and proximity to key amenities like schools, transit, shopping, or parks.
For organizations with customer, client, or member data, the ‘Nearby Analysis can be used to model catchment areas by assessing the density of individuals based on different distances and visualizing the patterns of change across distances. This improved data-driven decision-making will provide a deeper understanding of local context and interactions between places.
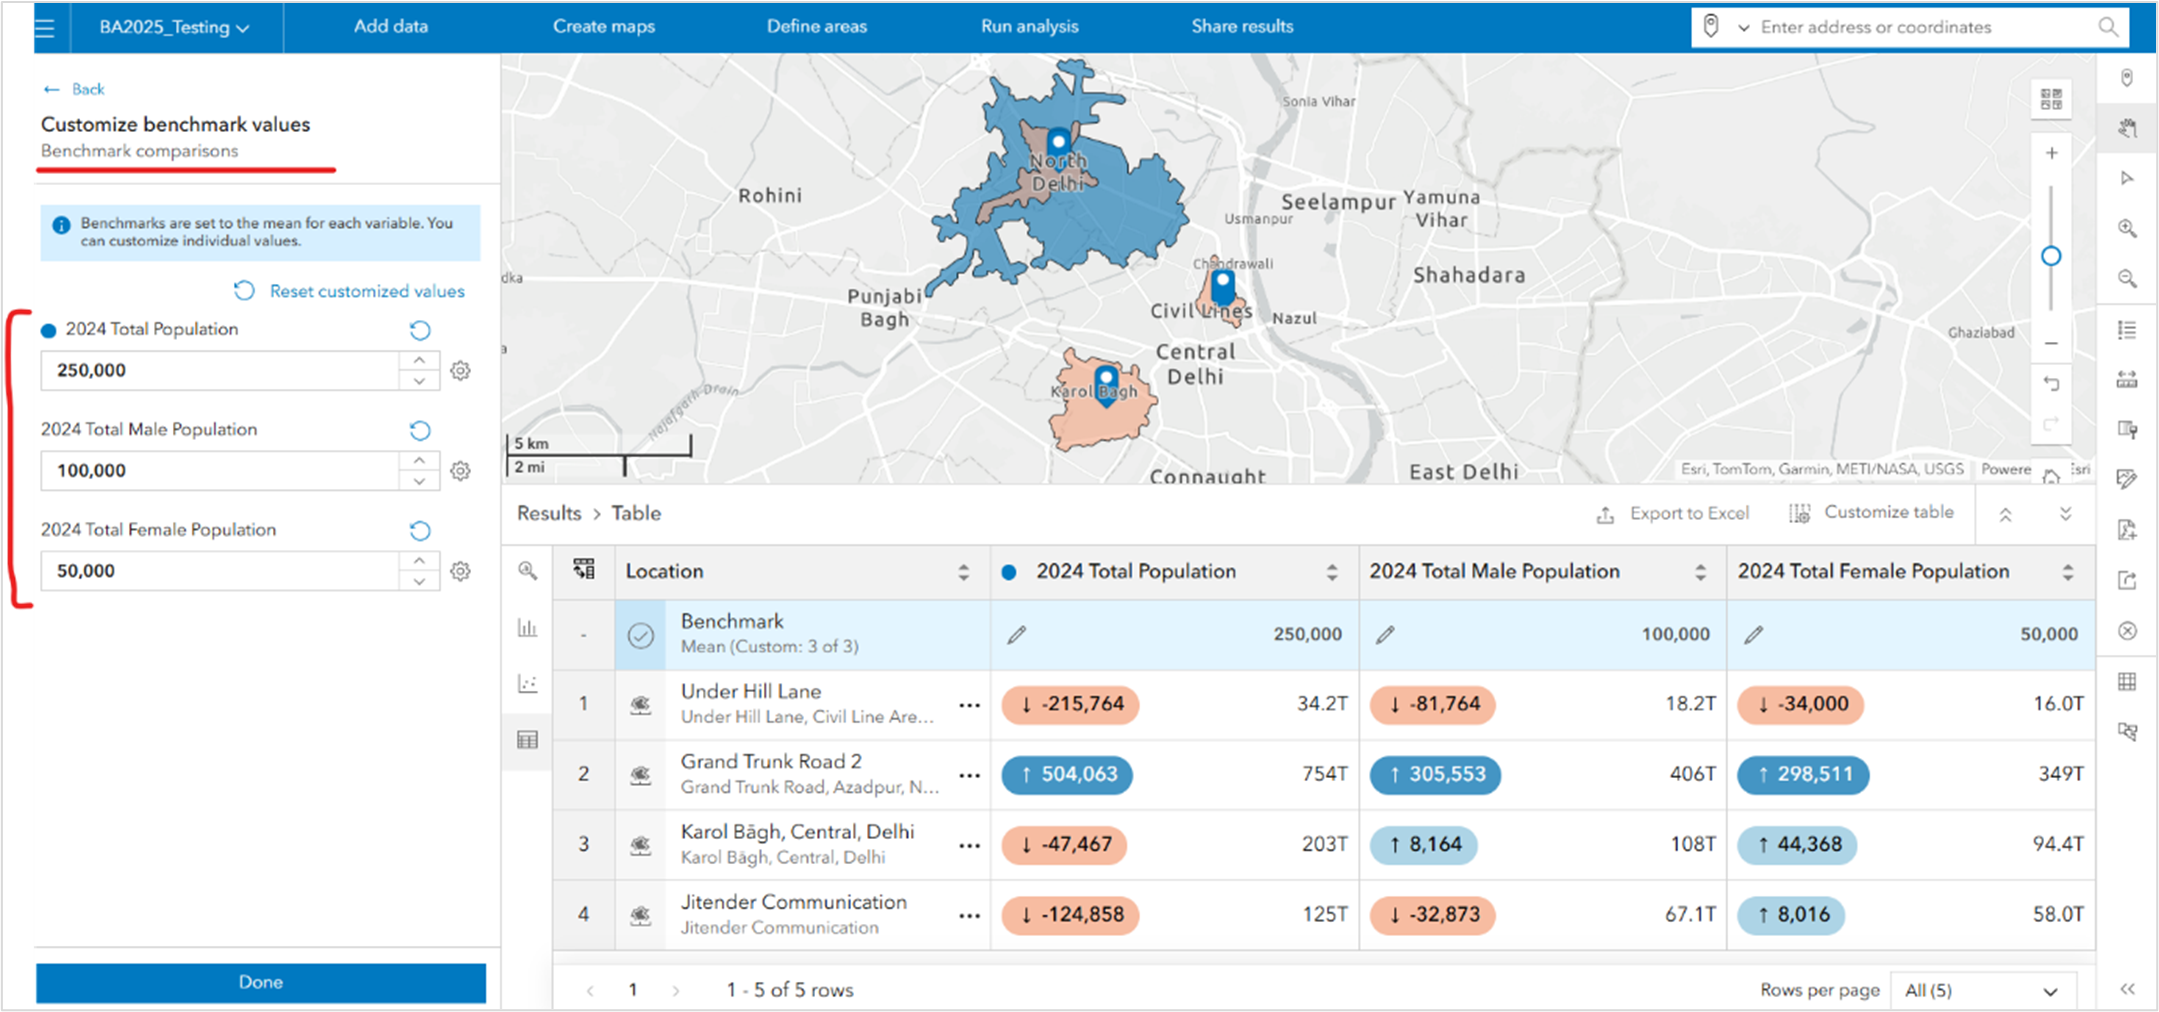
Flexible Benchmarking for Smarter Site Comparisons
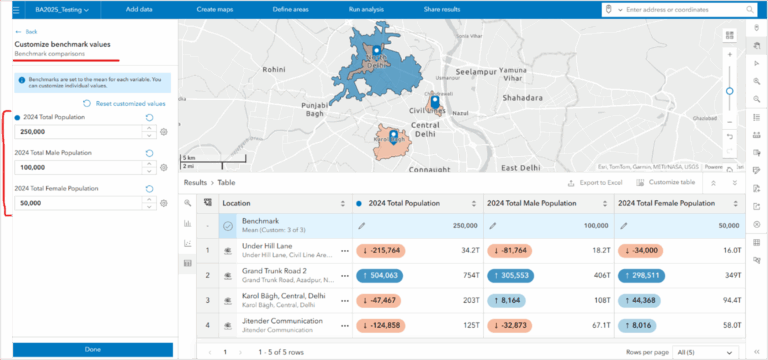
In the November 2024 release, we launched the map-based benchmark comparisons workflow, transforming the traditional comparisons report into a more visual and flexible experience. In the upcoming release, we are enhancing it by allowing users to define benchmarks not only by location, mean, or median, but also by setting custom values for each variable. This added flexibility helps tailor comparisons to specific goals, making insights more relevant and actionable.
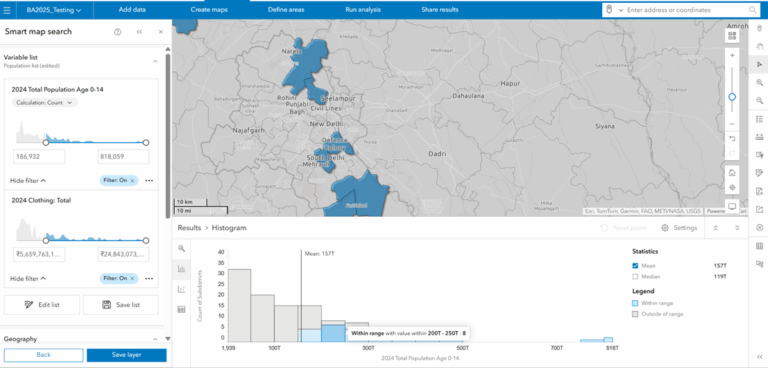
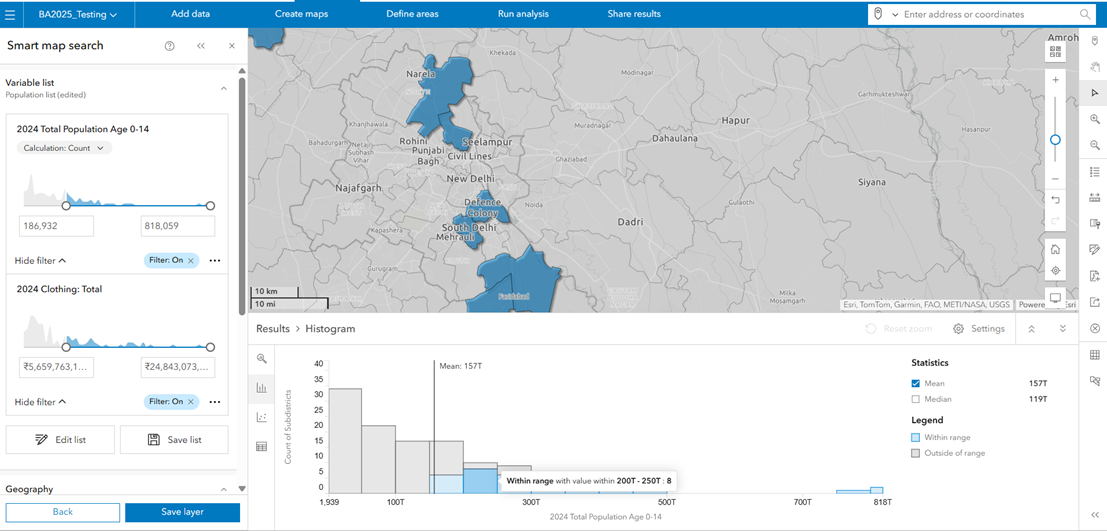
Visualize Distributions with More Control
We are enhancing the histogram tab in the Results pane for mapping and analysis workflows, making it easier to explore data distributions. The new visualization includes showing mean, median, and legends in the histogram view, plus styling controls to adjust chart types, bin counts, outlier visibility, and zoom.
Other Enhancements
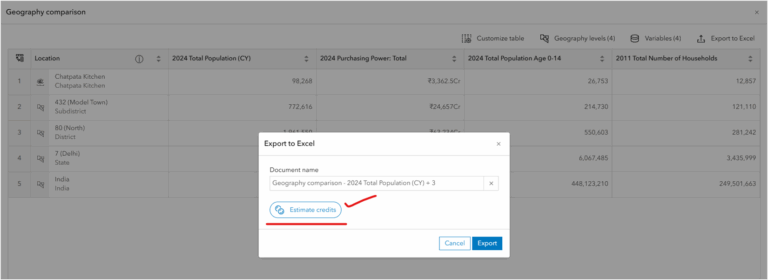
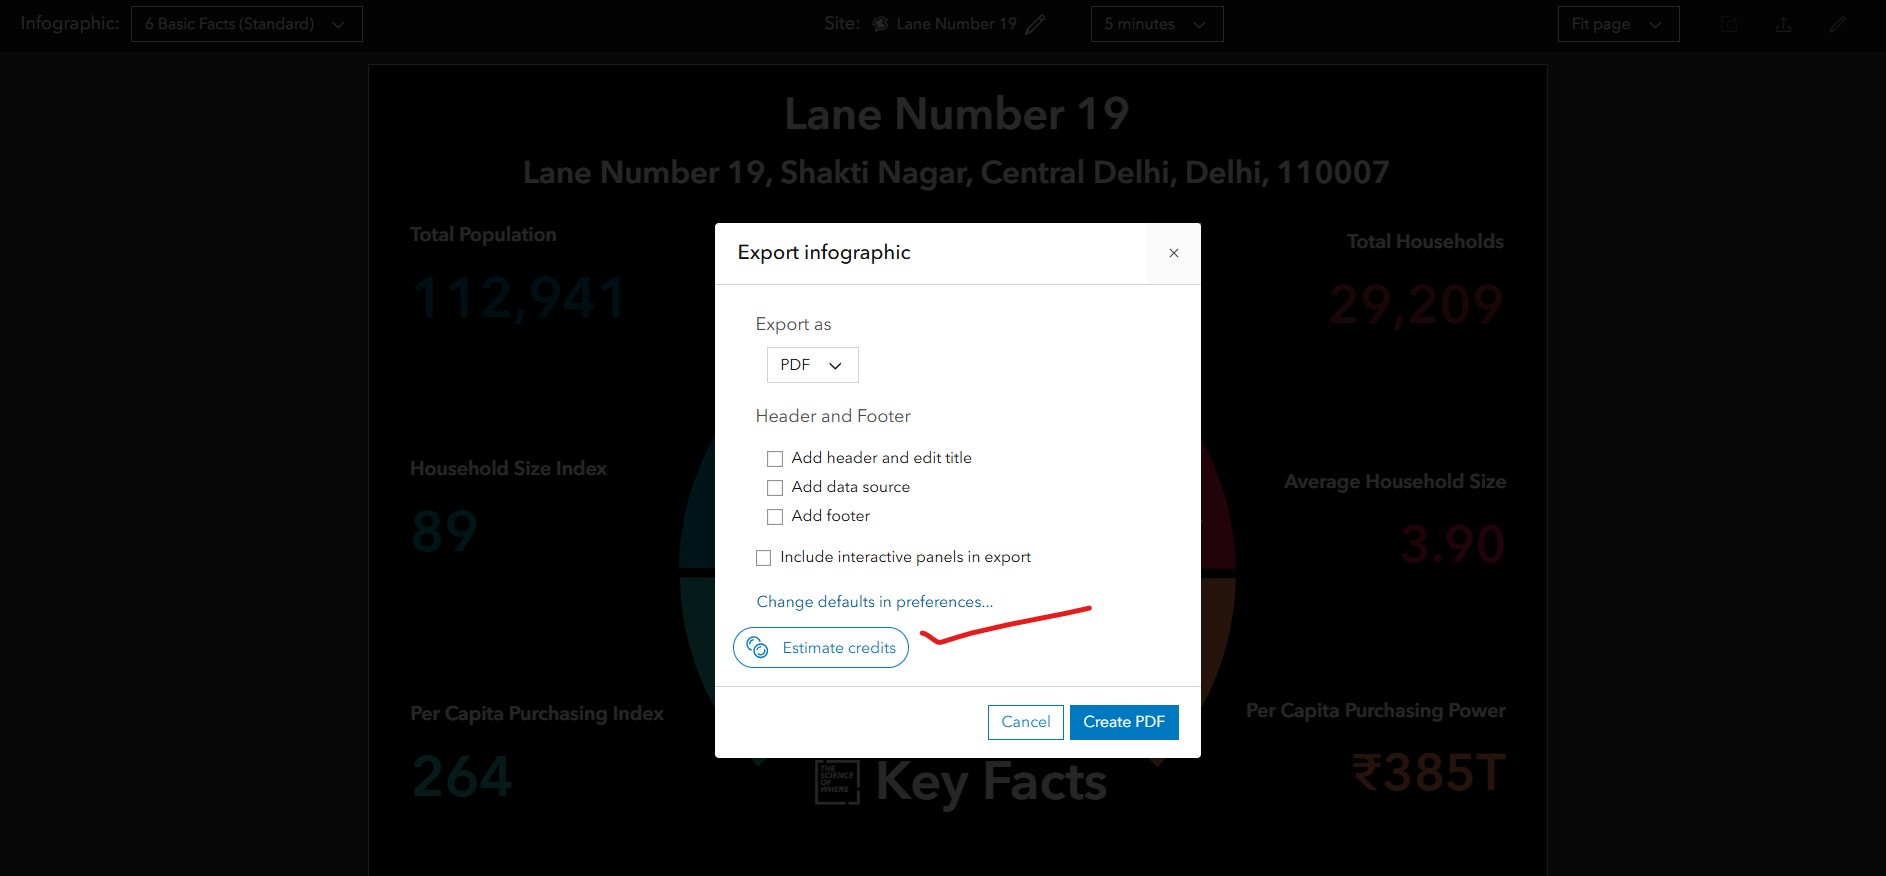
Know your Credit Costs Upfront
The upcoming release brings a much-requested enhancement: the in-app credit estimation tool, giving users upfront visibility into credit usage when exporting mapping and analysis results, infographics, and reports. Before completing an export, users will see an Estimate credits option that calculates how many ArcGIS Online credits the action will consume. This helps users avoid surprises, plan more effectively, and manage resources with confidence.
Improved Accessibility
We are dedicated to making our infographics more accessible to all users. We have made considerable progress in ensuring 508 compliance and enabling more organizations to share infographics on their websites for public information. We have improved keyboard tabbing and screen reading capabilities as well as updated colors for proper contrast for the histogram in the Results pane. For infographics, you can now add alt text for images.
Support for ArcGIS Online Settings
We have introduced two key enhancements to improve personalization and user experience in the ArcGIS Business Analyst Web App:
- Language Preference Sync: A new setting allows the app to automatically apply your ArcGIS Online member-level language preference. This means when you opt in, your ArcGIS Business Analyst Web App interface will now reflect your preferred language setting from ArcGIS Online, creating a more consistent experience across platforms.
- User Experience Improvement Program: The ArcGIS Business Analyst Web App is now part of the Esri User Experience Improvement Program. By default, users are opted in, and the app will send anonymous usage data to help the team better understand user behavior and continuously enhance the experience.
ArcGIS Business Analyst Mobile App
Several bug fixes and minor enhancements.
ArcGIS Experience Builder: Business Analyst Widget
Several bug fixes and minor enhancements.
Additional Resources
We are so happy to share this upcoming release of the ArcGIS Business Analyst Web App and the ArcGIS Business Analyst Mobile App with you.
Below, we have added resources to help you with your ArcGIS Business Analyst journey:
- ArcGIS Business Analyst Product Overview Page
- Review Buying Options
- Visit the Business Analyst Resources page
- Join our LinkedIn Business Analyst User Group
- Join our Business Analyst Esri Community

Kamlesh Sharma is a seasoned engineering leader with deep expertise in product development and innovation.