Spatial analysis is necessary to forecast demand in India’s fast-changing spaces. A new metro station, a flyover, a festival, or evolving cultural influences, any of them can turn yesterday’s low-demand zones into tomorrow’s demand hotspots. Spatial analysis weaves this data together into one big, clear picture.
Spatial analysis works by turning geospatial and geographical data into reliable insights that fuel confident decision-making.
This way, you’re not guessing where demand might show up; you’re seeing it take shape, in patterns that historic sales charts alone might never show.
Intriguing right? Let’s learn all about forecasting demand with spatial analysis in a GIS software.
What is spatial analysis?
Spatial analysis is the process of analyzing geospatial data to identify patterns, relationships, and trends that can guide business or policy decisions. By analyzing maps, satellite images, and coordinates, it uncovers insights to answer questions about demand, service coverage, resource allocation, and more.
It’s a bit different from geographic data. Spatial and geospatial data are usually tied to a specific location. On one hand, geospatial data reveals trends and relationships about a particular place. Geographic data, on the other hand, usually just describes the Earth’s surface and features. It’s the spatial layer that brings the patterns to life.
Like data, there are different types of spatial analysis in geography,
- Proximity analysis: It’s about understanding how distance impacts outcomes.
- Overlay analysis: It’s about finding relationships by stacking multiple layers of data together.
- Network analysis: It’s about studying how things move through or between networks like roads, delivery routes, or pipelines.
- Statistical surface analysis: It’s about examining data to identify hotspots, density patterns, and relationships.
Together, these methods can help businesses and governments to see how things are connected and what it can mean for their future plans
What’s the role of spatial analysis in demand forecasting?
Spatial data analytics can help forecast demand by identifying emerging clusters. It does this by analyzing factors such as proximity to economic hubs, key infrastructure projects, transit times, population density trends, and evolving supply-chain routes.
Spatial data analysis in GIS can stack these layers of data together to reveal insights that raw demographic, terrain, geographic, or spatial feature data can’t surface alone. Thus, it helps discern noise from signals and make more rapid decisions by showcasing a complete 360-degree picture of how different factors come together to shape demand.
Here’s how spatial analysis plays out for a business:
1. Helps you identify demand concentration
It identifies concentrated areas of high demand, like urban pockets where consumer behaviour shows sustained spikes in product purchases during a particular period, or particular days of the month.
2. Lets you understand temporal trends and patterns
This analysis reveals how demand changes with seasonal and local factors like festivals, weather patterns, and commute routes. Businesses can use this to identify periods of demand spikes.
3. It Flags anomalies and spots white-spaces
This points out deviations caused by changes in infrastructure, like disruptions in road networks, to spot market gaps and possibilities of demand rebound.
However, spatial mapping can not just spot this trend, but also explain why it’s happening. So, as competitors pull back, businesses can identify white spaces, where consumers are bound to return once the access improves. These same areas can experience a demand rebound, arming businesses with an edge.
Applications of spatial analysis for different industries in India
In the context of India, spatial analysis can be a blessing for forecasting demand and infrastructure strain. This means, for industries like logistics, retail, and even infrastructure planning, you can track and foresee urban growth, infrastructure load, and migration trends with GIS data.
With this, spatial analysis in GIS empowers decision makers to optimize resource allocation and seize emerging opportunities.
Here are a few examples of applications of spatial analysis:
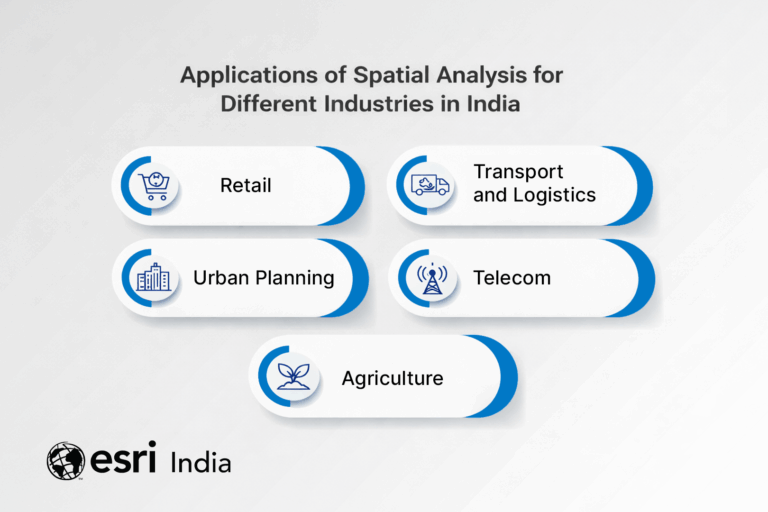
1. Retail
Forecasting retail demand is all about analyzing how recurring needs meet population trends, how consumer sentiment shifts, and how the local environment shapes unique buying patterns. Geospatial data analysis allows decision- makers to analyze site suitability by spotting these intersections visually, enabling them to decide their next best sites faster.
For example, here’s how spatial analysis in GIS can reveal different retail demands:
- Commute corridors: When people travel along busy routes, it creates steady demand for businesses like petrol pumps, takeaway food outlets, and ATMs, especially during morning and evening commute hours.
- Infrastructure-driven demand: New infrastructure like schools, housing clusters, shopping complexes, and corporate parks can slow certain kinds of retail centers in one area while redirecting them to others. Through spatial analysis, this information reveals opportunities for different types of retail businesses in specific locations.
- Events and seasonal surges: Temporary crowd gatherings or seasonal conditions can cause short-lived spikes in demand for specific products. Spatial statistics, collected over the years, reveal these periodic patterns that are tied to calendar events.
2. Transport and logistics
When it comes to logistics, forecasting demand is not only about moving things from point A to point B,. iIt’s about understanding what goods are needed in which areas, and how cost and time pressures shape the supply chain. You need answers to questions like:
- What mix of transportation modes is most efficient?
- Which routes drive maximum cost savings?
- What logistics mix is the fastest?
Spatial analysis exposes these differences with precision mapping product demand by location, network accessibility, transit times, fuel costs, toll charges, and storage constraints.
Here are a few examples of how spatial statistics and analysis can be used to track demand in logistics and transportation:
- Freight routes: Freight routes act like living ecosystems where warehouses, docking stations, and corridor services all feed each other. Spatial analysis enables you to see these relationships and identify the potential areas where freight volumes are likely to increase most.
- Urban delivery zones: By combining spatial data analysis with e-commerce trends, traffic patterns, and the last-mile capacity, one can see the exact areas that need more muscle and the ones that don’t.
- Seasonal and event-driven spikes: Spatial analysis in GIS can easily help identify seasonal peaks by combining historical data with location-based event calendars and agricultural cycles.
3. Urban planning
Spatial data analysis is key to planning cities that are resilient, have a great quality of life, and can accommodate population growth. GIS analysis can model how population, infrastructure, and civic services would need to grow together.
Powered by satellite imagery and ground-level spatial information, it lets planners see the full picture before making big decisions.
Here’s how spatial analysis in GIS helps plan more resilient cities:
- Optimizing resources: Spatial statistics and analysis show land distribution between housing complexes, commercial hubs, green spaces, and transport. So, urban planners can plan where resources can be rebalanced.
- Building naturally cooler cities: When cities replace tree cover and open soil with concrete, they trap even more heat, which turns neighbourhoods into heat pockets. Spatial data like satellite imagery, thermal maps, and land-use modelling can help planners avoid this.
- Environmental and hazard mapping: Identifying floodplains, heat islands, or air quality risks ensures development aligns with environmental safety and sustainability goals.
4. Telecom
Telecom companies can analyze patterns of demand, terrain, and infrastructure to plan for network resilience and cost efficiency. It can also enable telecom operators to understand regions of penetration density and new market opportunities.
Here are some areas where spatial analysis can be useful for telecom companies:
- Mapping coverage gaps: Telecom operators can identify areas with low network strength, the relationship between tower bandwidth usage and population density, and opportunities to expand or improve service.
- Planning service ceilings: Telecom operators can map traffic heatmaps to forecast tower congestion and required upgrades.
- Operationalizing new tech like 5G: Spatial statistics can be layered with data discerning income levels, bandwidth usage, corporate parks, and other major infrastructure to gradually rollout new spectrums.
5. Agriculture
Spatial analysis can be used to optimize crop yields as satellite imagery and field data can reveal factors like optimum areas of soil nutrition, rainfall patterns, wind, temperature, and air pressure data.
Here’s how spatial statistics can achieve better results for agriculture:
- Crop monitoring: Spatial data can help spot areas of crop stress or uneven growth across fields, giving businesses enough time to act accordingly.
- Yield forecasting: It can analyze soil patterns and other signals to predict harvest volumes by blocks.
- Pest & disease early warning: Spatial data can help reveal hotspots of disease and pest infestation to help farmers intervene early and avoid reactionary measures later on.
- Livestock & pasture planning: Farmers can recognize grazing corridors and vegetation strain to keep forage available across the year, without jeopardizing the health of neighbouring ecosystems.
What are the challenges and best practices of spatial analysis?
The quality of insights you get from spatial analysis directly depends on the quality and dimensionality of your data. Quality ensures that data is consistent and accurate. Dimensionality helps you see how relationships exist between data points. This balance is both a challenge and a best practice in spatial analysis.
Here’s a deeper look at the challenges and best practices of spatial data analysis.
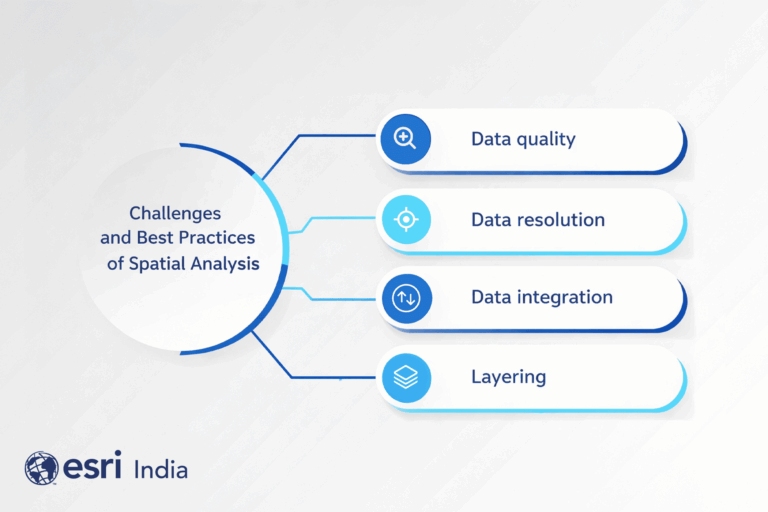
1. Data quality
Spatial datasets can be rife with gaps or outdated records that can skew the analysis. Moreover, inaccurate geocoding can cloud judgment, especially when it’s applied to complex landmasses like India. And in the absence of rigorous data cleansing, it can amplify errors.
2. Data resolution
Granularity of data plays a big role when it comes to the kinds of insights you can derive from it. Data that’s collected at city levels can’t reveal the demand shifts across a state or a country, and hyperlocal data can introduce noise in the model that can taint the insights.
Thus, advanced models, in ArcGIS®, that work with quality, granular data and algorithms provide unmatched insights that guide major decisions.
3. Data integration
Spatial analysis pulls data from diverse sources satellite imagery, GPS data, demographic surveys, and infrastructure maps. These often use different coordinate systems, formats, and update cycles. Without careful alignment, results can be inconsistent or misleading.
4. Layering
Different kinds of data tell different types of stories. For example, demographic data might reveal population density, and road networks can reveal pockets of high economic activity. On their own, they only tell a part of the story,
In a GIS software, multiple layers of data are combined to discern relationships, patterns, and trends that can meaningfully answer complex questions like where infrastructure investments can bring the most economic benefits or the pockets most susceptible to supply chain disruptions.
Final thoughts
India’s demand doesn’t swing for a single reason; it shifts with seasons, school calendars, corporate ecosystems, policy tweaks, cultural influences, and the everyday reality of power, water, and last-mile access. Spatial analytics brings that mix into account, so you see where the need will rise, how fast, and what will choke the supply.
With GIS, you move from static reports to living models that learn patterns, run what-ifs, and visualize hotspots that take shape. Thus, spatial analytics isn’t a discretionary add-on; it’s the much-needed edge in Indian markets.
FAQs
What is spatial analytics used for?
Spatial analytics is used to answer “where” and “why there” for real-world decisions. Common uses include:
- Site selection
- Catchment and trade-area mapping
- Route planning, risk, and hotspot detection
- Service coverage analysis
- Network planning (telecom, power, water)
- Public health tracking
- Disaster response
- Environmental monitoring
- Agriculture yield mapping
- City planning.
How does spatial analytics help in demand forecasting?
Spatial analytics helps you forecast demand by revealing relationships between entities like demographics, mobility, infrastructure, and competition that shape demand. It also analyzes historical data to pinpoint demand hotspots, seasonal fluctuations, and shifts driven by infrastructure or policy changes.
What are the tools for spatial data analysis?
Full suite software, like ArGIS, that comes complete with data, visualization tools, and analysis capabilities can be used for spatial data analysis. ArcGIS is the go-to tool for tasks like site suitability analysis, terrain modelling, hydrology mapping, distance and density calculations, and raster data analysis.
What are real-world examples of spatial data?
Real-world examples of spatial data include:
- GPS coordinates
- Satellite or drone imagery
- Road and rail networks
- Building footprints
- Land-use/land-cover
- Elevation/terrain (DEM)
- Weather grids
- Flood zones
- Census boundaries
- Mobile footfall aggregates
- Store locations
- Competitor locations
- Utility assets
- Travel-time isochrones derived from road speeds
How is spatial analysis used in retail forecasting in India?
Retailers use spatial analysis to map demand by place,: ward-level demographics, footfall near metros and markets, travel times by time-of-day, and competition density. They plan new sites in growing Tier-2 and Tier-3 cities, adjust stock for festivals and monsoon disruptions, and use grids and isochrones where addresses are unreliable. All of this helps forecast demand and plan inventory proactively.
Written by
Esri India Marketing