Skip to Content

Response

Mapping tools for fighting COVID-19

Observe, understand, and respond with location intelligence

Responding to the COVID-19 pandemic

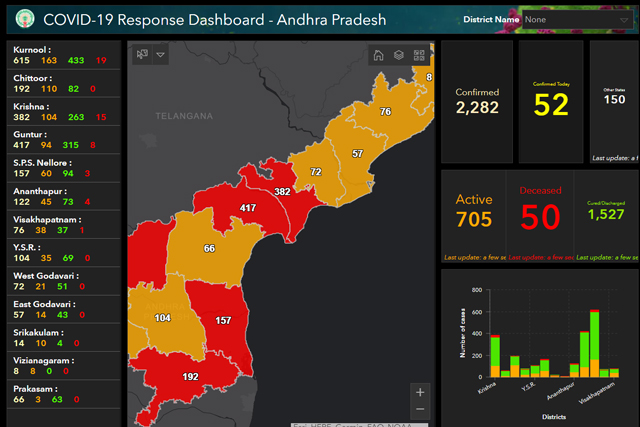
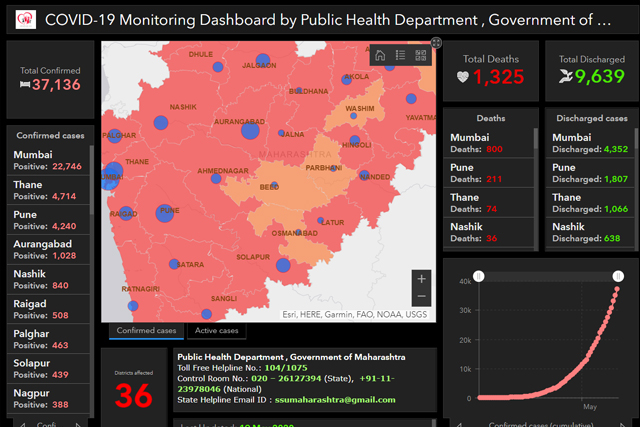
GIS provides public health modeling and mapping tools for surveillance and monitoring, understanding resource capacity and needs, and improving critical communication. Maps deliver the insights needed to plan and respond in a rapidly changing environment and help slow the spread.
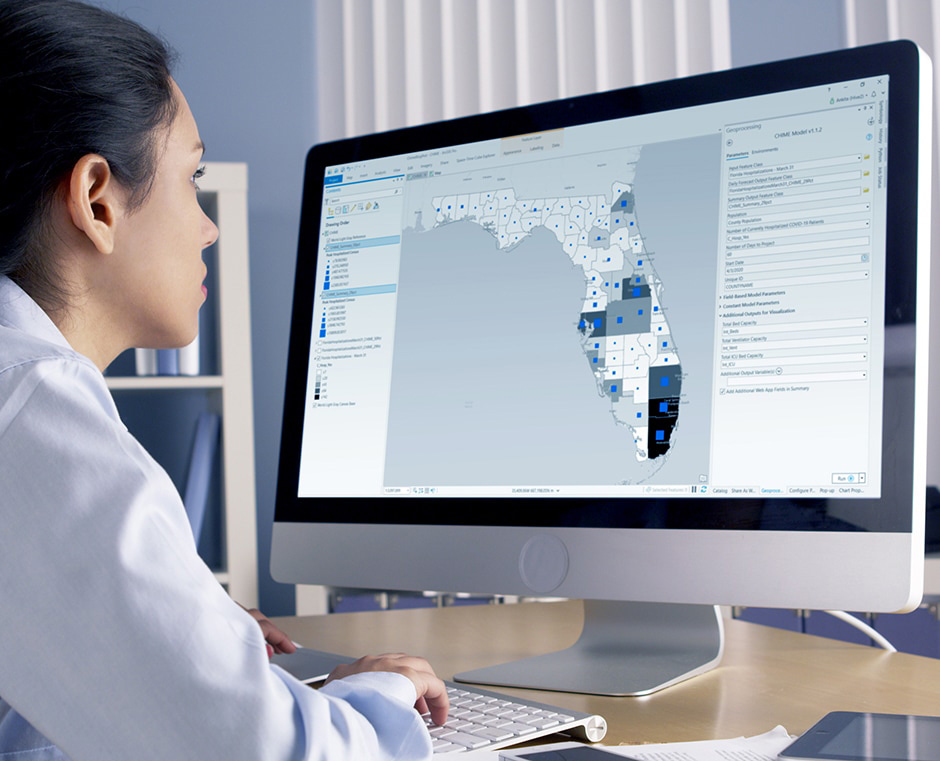
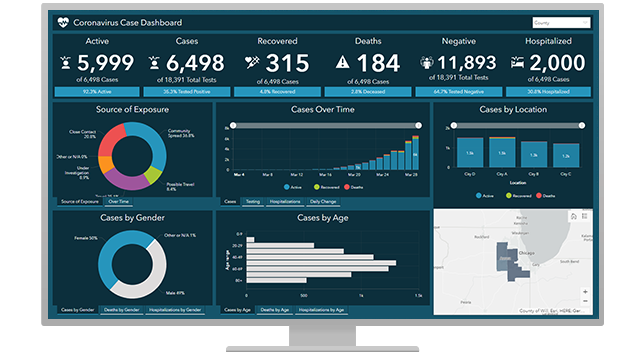
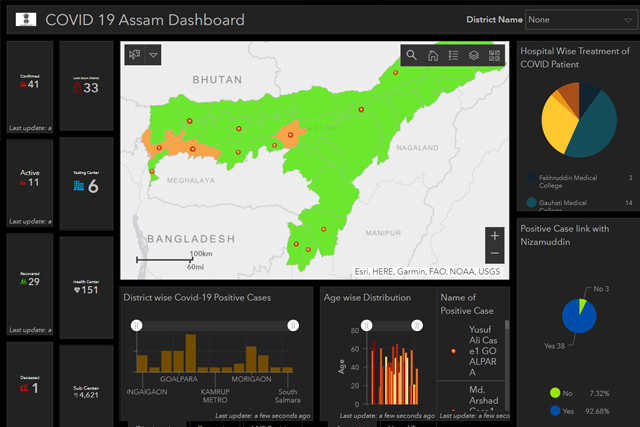
Observe

Collect real-time data on cases, testing sites, medical facilities, and inventory and capacity for key resources. Visualize the data with maps.
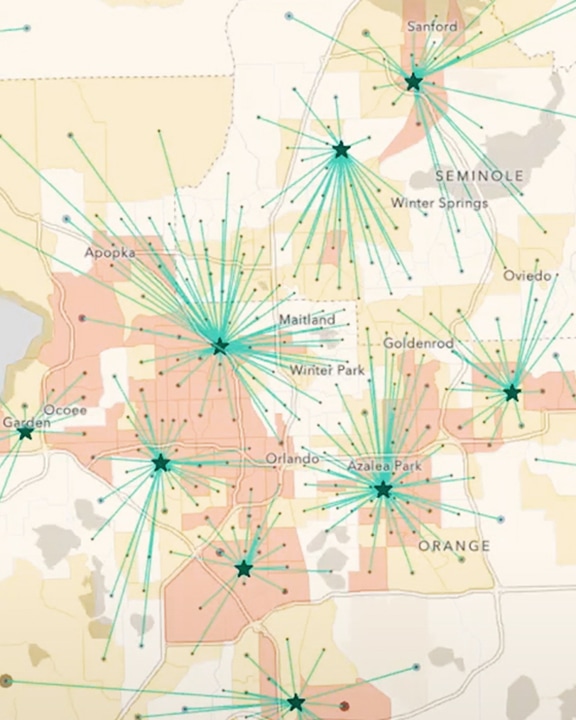
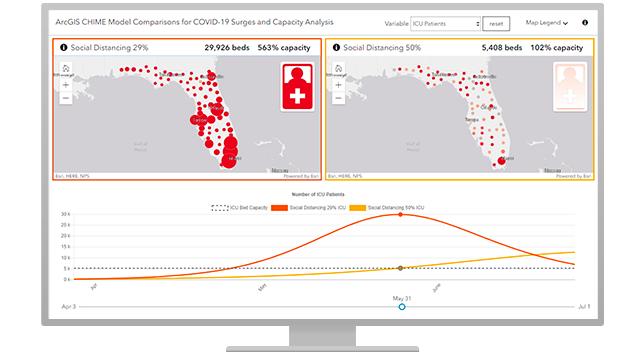
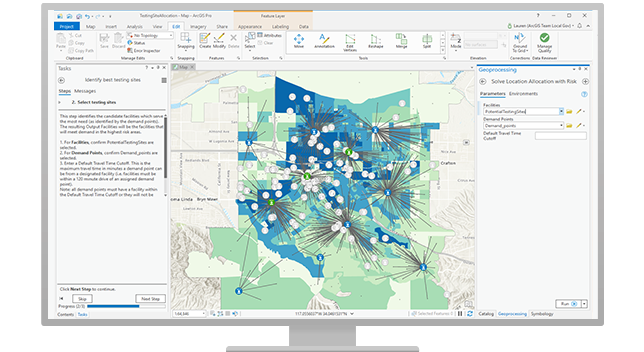
Understand

Analyze case data, bed and resource capacity, and community mobility. Identify where critical resources are needed and prioritize interventions.
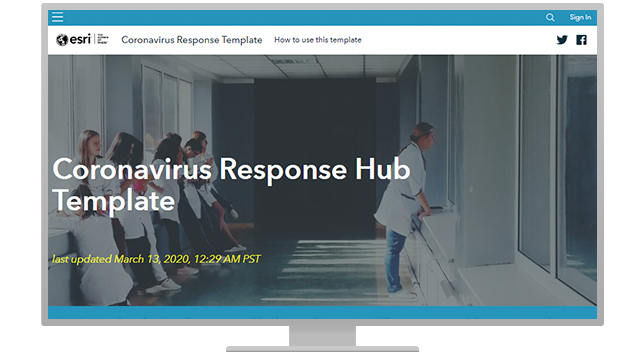
Respond

Deploy resources based on real-time insights from the field, enhance critical communications, and monitor how your efforts are working.

Contact Esri for assistance

For urgent GIS help, contact Esri’s Disaster Response Program

How ArcGIS aids response

Inventory and map key resources

Monitor the current inventory of personal protective equipment (PPE) and the capacity and status of facilities. Map the location of these resources and their readiness to deliver critical services.

Get the ArcGIS solution
Dashboard showing available PPE and hospital capacity numbers

Model the surge

Use common public health modeling tools like the COVID-19 Hospital Impact Model for Epidemics (CHIME) and the Centers for Disease Control and Prevention's (CDC) COVID-19Surge to understand and visualize outbreaks and the potential impact on your community or organization.

Get the ArcGIS Pro models
Software showing predicted surge curves in different scenarios

Manage testing sites

Mapping social vulnerability, age, and other factors helps identify at-risk groups and target locations for testing sites that serve the greatest need. Optimize site locations and communicate their status to the public.

Get the ArcGIS solution
A COVID-19 testing site map being created in ArcGIS Pro

Monitor community indicators

Tabulate authoritative case data and information from teams in the field. Monitor real-time trends of key health and economic indicators using dashboards for situational awareness.

Get the ArcGIS solution
A dashboard of COVID-19 data built with Esri’s Coronavirus Response solution

Communicate and inform

Use interactive web maps, dashboard apps, and ArcGIS StoryMaps stories to help rapidly communicate your situation so everyone stays aware.

Get the ArcGIS Hub template
Example communications website hub

Examples of organizations responding across India

  • Assam COVID-19 Dashboard

    Author: Government of Assam

  • Andhra Pradesh COVID-19 Dashboard

    Author: Department of Health, Medical, & Family Welfare, Government of Andhra Pradesh

  • Maharashtra COVID-19 Dashboard

    Author: Government of Maharashtra

Previous
Next

Contact Esri India to get started

Fill out this form, and we will contact you to help you understand how your business can respond to COVID-19.