Cover Story
GIS Mapping a Better Future
GIS provides a platform to store, manage, and analyze geospatial data to help make informed decisions in a variety of fields.

Cover Story
Table of contents
Cities are the hubs where culture, commerce, innovation, and human interaction thrive. With the massive shift toward city living, the concept of “livability” has become central to discussions around urban planning, public policy, and sustainable development. But what exactly makes a city livable?
At its core, livability refers to the quality of life in a city, encompassing aspects like safety, affordability, accessibility, and overall well-being of its residents. It’s not just about what a city has, but how these elements are combined in a way that fosters a high standard of living.
Urban planning and land use are fundamental in making cities more livable by strategically organizing spaces to enhance functionality, sustainability, and quality of life. Effective land use ensures that residential, commercial, and recreational areas are appropriately zoned, reducing overcrowding and congestion while providing easy access to essential services such as healthcare, education, and transportation. Proper urban planning incorporates green spaces, pedestrian-friendly designs, and mixed-use developments, which promote social interaction, physical well-being, and environmental health. Thoughtful land use can also help minimize environmental impacts, reduce traffic, and lower pollution levels, making cities more sustainable and healthier places to live. By balancing development with green areas and public infrastructure, urban planning fosters vibrant communities that are accessible, equitable, and resilient, ultimately improving the overall experience of urban life.
How GIS Transforms Urban Planning
Effective urban planning is crucial for creating livable cities, and GIS is at the heart of this process. By providing spatial data and tools to analyze land use patterns, population densities, and growth trends, GIS helps planners make informed decisions about where to place new developments, infrastructure, and public services.
GIS allows planners to analyze land-use patterns, helping to ensure that cities grow in an organized and sustainable manner. By examining how land is currently being used (residential, commercial, industrial, recreational, etc.), GIS helps optimize land distribution and avoid issues like congestion. This helps ensure that people have access to necessary services (e.g., schools, hospitals) without the long travel times typically seen in poorly planned cities.
GIS supports the concept of smart growth by identifying areas where dense development is appropriate and areas where open space should be preserved. This can help prevent urban sprawl, preserve natural resources, and encourage mixed-use developments, which are essential for creating walkable, vibrant communities.
GIS is used to map and assess infrastructure such as roads, water supply systems, sewage networks, and power grids. Urban planners can use this data to identify areas in need of improvement, ensuring that infrastructure investments are efficiently allocated and enhancing the overall functionality of a city.
Esri’s ArcGIS is helping cities to become more sustainable, resilient, and livable. By allowing urban planners, city officials, and stakeholders to collect, manage, analyze, and visualize spatial data, ArcGIS empowers data-driven decision-making. It offers valuable insights into urban environments, enabling better planning across various aspects of city development. By utilizing ArcGIS, cities can enhance their planning efforts, making them more data-driven, sustainable, and responsive to the needs of their citizens.
ArcGIS offers a suite of tools vital for urban planning, including ArcGIS Urban for 3D planning and impact analysis, ArcGIS Pro for spatial analysis and data management, and ArcGIS CityEngine for creating detailed 3D city models.
ArcGIS Urban provides an immersive 3D experience designed to improve urban planning and decision-making. Using the software, urban planners can quickly visualise their projects in the local context and leverage location intelligence to drive better decisions. ArcGIS CityEngine is a procedural 3D city generator that aids in creating and iterating on urban environments and scenarios.
The main function of Gurugram Metropolitan Development Authority (GMDA) is to prepare plans, policies and proposals for guiding the city’s planned development. To accomplish the mission of GMDA, to be a major support in governance by embedding GIS in all aspects of decision making, planning & management, OneMap Gurugram was developed on Esri platform by the GIS division of GMDA.
OneMap Gurugram provides vivid details of various infrastructure in the city through its webGIS portal named “Onemapggm”. The site provides details of dry infrastructure like Rail, Road, Telecom Towers and Metrolines. It also provides wet infrastructure details like Water Distribution Network, Sewage Network, Drainage network and recycled network with Network Asset details and Power infrastructure, Public transportation facilities, Land Governance Layers, health facilities, homeland security, image services and similar other information. OneMap Gurugram is a detailed and accurate geoenabled intelligent Decision Support System, aligned with objectives of development of the state that increases effectiveness of land acquisition, planning, compensation and providing urban services, etc. The GMDA has adopted a hub type framework for the collaboration of different departments under the Smart City. The platform clusters GIS layers of information into different applications as per the departmental requirements. The same platform is also being leveraged for integrated Command & Control Centre under mission through various interactive dashboards.
Sustainable transportation systems are vital for making cities more livable as they help reduce congestion, improve air quality, and promote better overall health for residents. By prioritizing public transit, cycling, and walking infrastructure, cities can create more accessible and efficient mobility options, making it easier for people to travel without relying on private cars. This not only reduces traffic and pollution but also helps lower greenhouse gas emissions, contributing to a healthier environment. Sustainable transportation systems encourage more equitable access to jobs, education, and essential services, especially for those who cannot afford private vehicles. Furthermore, they help create vibrant, people-centered urban spaces by reducing the need for vast parking lots and making room for parks, green spaces, and community areas. Overall, sustainable transportation fosters a more connected, cleaner, and healthier urban environment, enhancing the quality of life for all residents.
How GIS aids in Building Sustainable Transportation Systems
GIS helps create sustainable, efficient transportation networks by providing real-time data and supporting long-term planning efforts. It allows cities to monitor and analyze traffic flow patterns in real-time. This data helps city officials identify traffic congestion hotspots and determine where new infrastructure (e.g., roads, public transport routes, or cycling lanes) is needed to alleviate bottlenecks. By identifying areas of inefficiency, GIS can help optimize the movement of vehicles, reduce delays, and lower air pollution.
GIS is widely used to map public transportation routes, stops, and stations. It can help identify underserved areas or areas where public transport services are inefficient. Using GIS, cities can better plan transport systems to improve accessibility and reduce the dependence on private vehicles. For example, planners can ensure that high-density residential areas are well-connected to business districts, schools, and hospitals.
GIS helps in determining capacity enhancements, improving operations, and identifying the most strategic investments for keeping the transportation system in any country running optimally. The use of GIS in transportation is widespread. The major areas of applications include road and highway maintenance, traffic modeling, accident analysis, and route planning.
Roads and Highways
GIS in road and highway planning helps in visualizing and understanding the condition of the existing assets and the performance of the transportation network. It also helps in analyzing needed safety improvements to determine the best mix of new projects and required maintenance activities. With location intelligence, the stakeholders can strategically prioritize their investments.
Esri’s mobile GIS technology allows transportation maintenance and inspection crews to save time when collecting and updating information from remote locations. By using GPS and GIS-enabled devices, field crews accurately collect information from the field, and officials can track resources and assets in real time. This allows for a quick response to any event that requires immediate attention. They can also more effectively manage mobile resources by instantly seeing the location of any work or inspection crew on a map, then redeploy resources as needed. The integration of work order management systems, routing, and scheduling software allows managers to more efficiently direct their mobile workforces and ensure that resources are most effectively utilized.
Traffic Modelling
GIS data can also be transformed into functional road models for large-scale traffic simulation. 3D models of large-scale road networks can be readily used in a real-time traffic simulation, interactive visualization of the virtual world, and autonomous vehicle navigation. The resulting model representation can also provide important road features for traffic simulations, including smoothly connected highways, overpasses, merge zones, and intersections.
The ArcGIS Network Analyst extension for ArcGIS Pro and ArcGIS Enterprise enables the effective movement of goods, efficient organization and coordination of vehicles, and intelligent transport network analysis. Users can make smarter decisions by developing strategic routing plans and save time and money by creating and implementing daily route plans to solve vehicle routing problems and perform post-route spatial network analysis for greater insight.
Accident Analysis
Traffic accidents are one of the most important national and international issues, and their consequences are important for the political, economic, and social levels in a country. Management of traffic accident information requires information systems with analytical and accessibility capabilities for spatial and descriptive data. GIS delivers powerful spatial analytics, allowing the authorities to discover patterns and gain intelligence to better understand travel behavior and perform accident analysis.
GIS significantly helps in accident analysis and leads to a reduction in the number of accidents on roads as well. GIS allows a more careful and accurate data selection, screening, and reduction. Also, it allows a spatial analysis of the results in pre and post-processing. It allows the development of spatial statistics that rely on geographically referenced data. For instance, through the analysis of accident history, a transportation firm is able to identify significant safety issues and determine areas where measures can be taken to reduce the number of incidents. GIS can also allow the user to choose two months of accidents for comparison. The statistics can be useful in displaying a decrease in accidents over a period of time.
Route Planning
Route planning is an important application within transportation. Hurdles on routes can lead to unnecessary delays and losses. It is in favor of all businesses and people to know in advance which route is the best to follow. This knowledge can help in saving time and essentially gaining the best cost/benefit ratio. GIS-based systems quickly provide and analyze essential economic, demographic, and cost estimates for planning new routes. It helps in analyzing existing routes, collecting data, and informing the riders of changes to routes.
Managing modern roadways is a complex affair. From computerized traffic control systems and incident and safety management systems to effective capital improvement planning and maintenance activities, transportation planners must draw on a wide array of technologies to effectively manage today’s roadways. GIS can help transportation planners to integrate agency-wide information to achieve better operational efficiencies and results. By bringing GIS in transportation, higher efficiency can be achieved in the entire infrastructure lifecycle - from planning and design through survey and construction management to operations and maintenance. GIS helps in mitigating woes, both for the travelers and the planners. As the travelers get to know about the best routes for their destinations, transportation professionals get equipped with enhanced ability to manage their infrastructure.
The Transportation network is the backbone of all developmental activities in the state of Tamil Nadu. With exponentially increasing motorized vehicles, there is a need for supporting road and related infrastructure and continuously monitoring and managing this vast network to make quick, reliable, and rational decisions on upgrades and maintenance. The Tamil Nadu Highways Department (TNHD) is primarily responsible for the construction and maintenance of about 60,000 kilometres of road network. The Department was facing problems in dealing with an exponential increase in data related to the road system and required a GIS solution to manage the same.
TNHD deployed a solution centered around Esri’s ArcGIS Server technology. TNHD envisioned a web-based GIS road and bridge information system under the e-Pathai (Electronic Project, Administration, Traffic, Highway Assets and Information Management System) program by integrating the GIS solution with the TNRMMS and the Project & Finance Management System (P&FMS).
This led to the integration of spatial and non-spatial data into the e-Pathai GIS from several sources such as the Survey of India (SOI), Open Series Maps (OSM), the Census of India, and the Indian Meteorological Department. Customized query and analysis tools were also developed specifically for the TNHD.
Multi-lingual support allowing users to switch between English and the Tamil language was offered, and the solution encompassed video integration with the web GIS interface.
Enhanced utilities management plays a crucial role in making cities more livable, especially as urban populations continue to grow. Efficient management of essential services such as water supply, electricity, waste disposal, and public transportation directly impacts the quality of life for residents. By adopting smart technologies, data-driven planning, and sustainable infrastructure, cities can ensure the reliable delivery of these services while minimizing environmental impact. Improved utilities management not only reduces resource waste and operational costs but also fosters healthier, cleaner, and more resilient urban environments. Ultimately, it forms the backbone of any initiative aimed at building cities that are not just functional, but truly livable for current and future generations.
How Geo-enabling Utilities Infrastructure & Operations Helps
With Esri’s ArcGIS platform at the center-stage, Indian utilities have been increasingly harnessing the geographic potential in the last few decades. By geo-enabling their infrastructures, utilities capture, store, manipulate, analyze, manage, and present, data from disparate sources across networks on a unified platform. Thrissur Municipality, Orange City Water (Nagpur) and Municipal Corporation of Greater Mumbai (MCGM) have taken lead in geo-enabling automation of their water / wastewater utility operations.
Facilitating planning, design, monitoring and maintenance of networks, GIS is becoming invaluable to utilities for strategic and operational decision support in the management of - land information, distribution, transmission, outages, workforce, revenue, compliance, network integrity, surveillance and infrastructure protection and emergency response. In the power utility sector - Sterlite Power, Tata Power, BSES Yamuna and many state owned discoms are leveraging ArcGIS to improve their operational efficiencies, reduce AT&C losses while providing enhanced services to their consumers.
In the telecom sector, Airtel and Reliance Jio rely on ArcGIS platform for their network operations, asset management, workforce management, marketing, and customer service improvement. And in the oil and gas sector IOCL, Mahanagar Gas Limited, Gujarat Gas Limited, and many others have been leveraging ArcGIS for their operations and asset management.
Geo-enabled network mapping and asset mapping are enabling quicker detection of faults for faster response while at the same time achieving better management of assets and resources. It is noteworthy that only a small part of the available geographic potential is being currently tapped. With still a lot of potential available that can be leveraged, utilities are gearing up for advancing their geo-enablement efforts for a sustainable digital future. By leveraging machine learning and artificial intelligence, utilities are now aiming to exploit the advanced capabilities for predictive modelling and simulation.
ArcGIS Utility solutions are making access to contextualized information easier than ever, helping utility CXOs to address their priorities better than before. They are helping organizations to stay agile in the changing times and drive innovation. By augmenting existing frameworks with ArcGIS Utility Network, utility CXOs can enhance their business value delivery while optimizing operations for improved efficiencies and increased customer satisfaction, paramount for creating more livable cities.

Green organ corridors are demarcated, cleared-out special road routes created so that the organs arrive at their specified destination within the shortest possible time. Traffic congestion can defeat the cause. With the help of ArcGIS, RSAC-UP discovered the best route for developing a green organ corridor between CDRI, Jankipuram, and Amausi Airport in the city of Lucknow.
The Road Network Analysis helped in finding the best route to healthcare facilities among the four possible routes. Network connectivity can explain significant variance in the spatial pattern of the network structure. Analysis reveals that transport network services are directly varying with respect to connectivity indices and coverage of the study area. The use of the ArcGIS Network Analysis tool in the route optimization study provided the following benefits to RSAC-UP:
Identifying the best new route among healthcare facilities: Utilizing network analysis methods, the optimal new route between CDRI, Jankipuram, and Amausi Airport, Lucknow was developed from a list of four possible routes. This route is more effective in terms of the minimal distance required for hospital connectivity.
Defining service areas based on distance and time for healthcare facilities: By this analysis, the actual service area of different facilities can be analyzed, and it can be determined whether these facilities are enough for that area, if not, then how much is required. This is also called service allocation analysis.
Connectivity of road segments: The most basic characteristics of a transport network are measured by the Alpha Index, Beta Index, and Gamma Index. The network (line) and junction (node) are required to obtain the connectivity index. These indices are useful for system and traffic analyses to detect changes in network structure. The Beta index ( ) is used to determine the level of road connectivity. The Alpha index ( ) is the ratio of the actual number of circuits in a network to the maximum possible number of circuits in that network. The Gamma index ( ) is a measure of the ratio of the number of edges in a network to the maximum number possible in a planar network.
382 edges and 252 nodes were found in the buffer zone of 1 km in Route 1, 772 edges and 497 nodes were found in the buffer zone of 1 km in Route 2, 949 edges and 567 nodes were found in Route 3, and 1335 edges and 847 nodes were revealed in route 4 through the road network analysis using ArcGIS.
Following a thorough analysis of all four routes, it was noticed that Route 3 has the highest network connectivity, resulting in a low rate of accidents involving pedestrians and bicyclists. It was also observed that higher connectivity levels are associated with fewer accidents involving nonmotorized users. Nodes around Route 3 also displayed a good level of accessibility.
Focusing on public health and well-being is essential for making cities more livable, as it directly impacts the quality of life for all residents. Urban environments that prioritize health and well-being integrate access to clean air, safe drinking water, and green spaces, which contribute to both physical and mental health. Designing cities with pedestrianfriendly streets, bike lanes, and recreational areas encourages active lifestyles, reducing the risk of chronic diseases like obesity and heart conditions. Furthermore, cities that invest in healthcare infrastructure, affordable housing, and sanitation services ensure that all residents have access to basic needs, improving overall life expectancy and well-being.
The Role of GIS in Public Health and Well-being
GIS plays a key role in improving the health outcomes of urban populations. By analyzing spatial patterns of disease, environmental hazards, and access to healthcare services, GIS can inform policies that promote health and well-being in cities.
GIS allows public health officials to map the spread of diseases or identify patterns of health issues across neighborhoods. For example, GIS can be used to track the prevalence of diseases like asthma, which are often related to air pollution, or to monitor the spread of infectious diseases. By understanding the geographic spread of health issues, cities can allocate healthcare resources more effectively and design targeted interventions.
GIS is used to map healthcare facilities and the accessibility of medical services for urban populations. It helps identify areas with inadequate access to healthcare services, allowing for the strategic placement of new clinics, hospitals, or emergency services. Additionally, GIS can help determine the optimal locations for mobile health clinics or vaccination campaigns to ensure that underserved populations receive the care they need.
Poor air quality is a significant concern in many urban areas. GIS allows for the monitoring of air pollution levels in realtime, helping authorities to identify areas with high pollution levels and take corrective actions. This could include rerouting traffic, reducing emissions from industrial sites, or creating policies to improve air quality in highly polluted areas.
Environmental sustainability and green spaces are crucial for making cities more livable, as they directly impact the health, well-being, and quality of life of urban residents. Green spaces such as parks, urban forests, and green roofs help improve air quality by absorbing pollutants and carbon dioxide, while also reducing the urban heat island effect by cooling the environment. These spaces promote mental and physical health by offering areas for relaxation, recreation, and exercise, which help reduce stress and encourage community interaction. Additionally, they play a vital role in preserving biodiversity by providing habitats for wildlife in otherwise concrete-dominated environments. Green spaces also enhance resilience to climate change, helping manage stormwater, mitigate flooding, and improve energy efficiency by providing natural shade to buildings. By promoting social cohesion, reducing environmental stressors, and supporting economic growth through tourism and property value increases, green spaces are essential for creating cities that are sustainable, resilient, and more enjoyable for their inhabitants.
Addressing Environmental Concerns with GIS
GIS is invaluable in the creation and maintenance of green spaces, natural habitats, and sustainable urban environments. By providing data on environmental conditions and monitoring urban development’s impact on the ecosystem, GIS helps cities mitigate environmental issues.
GIS helps cities analyze the risks posed by climate change, such as rising sea levels, extreme heat, or flooding. By mapping ve. GIS tools also aid in disaster response by providing realtime data on infrastructure damage, helping emergency responders prioritize resources.
In collaboration with Himachal Pradesh Electricity Regulatory Commission, AGiSAC has carried out a study to identify suitable sites of land for Solar Power plant installation. Disparate datasets such as imagery, DEM, land use, settlement clusters, and locations of existing infrastructure such as roads and electricity sub stations were used in ArcGIS Pro spatial overlay analysis to find suitable sites along with solar power potential calculated in MW. Following the GIS study, field visits were undertaken to verify the optimum locations.
AGiSAC has used ArcGIS spatial analysis tools to streamline the complex process of running suitability analysis. The ArcGIS Desktop platform provides an interface where raster, vector, and tabular data can be ingested and analyzed. The Suitability Modeler tool allows disparate datasets such as DEM, satellite imagery, LULC maps, as well as vector datasets such as roads and human settlement, to be overlaid to delineate suitable areas according to user-defined thresholds. ArcGIS has proved invaluable in the analysis of both raster and vector datasets. The user was able to carry out advanced proximity analysis to measure the accessibility of potential Solar Power Plants to existing roads and electric substations. High-resolution land use maps were also created using image classification tools on CARTOSAT-1 imagery. Tracts of barren land extracted from this classification were identified as the most suitable land use type for Solar Power plant installation. The suitability modeler tool then overlaid all the resultant layers and applied a uniform user-defined index to assess the suitability of each class for the construction of a PV plant. Several zones that best matched each user-defined threshold were then extracted from each district, which was further verified via field survey.
Geographic Information Systems (GIS) are essential tools in creating cities that are more livable, sustainable, and resilient. From improving urban planning and transportation to promoting social equity and public health, GIS enables cities to optimize resources, enhance decision-making, and engage communities in the urban development process. As urbanization continues to rise, the role of GIS in shaping the cities of tomorrow will only become more significant, helping to create urban environments that are not only functional but also inclusive, sustainable, and truly livable for all.

To download the PDF version of this article, click the button below.
GIS provides a platform to store, manage, and analyze geospatial data to help make informed decisions in a variety of fields.
The MCD GIS citizen portal is a step towards better governance taken by the Municipal Corporation of Delhi to allow the citizens of Delhi to avail various services through an easy-to-use interface along with geo-referential data.

In the heart of Rajasthan, R-CAT (Rajasthan Centre of Advanced Technology) emerges as a beacon of innovation and knowledge. Established by the Government of Rajasthan, it’s not just an institute- it’s a gateway to the future.
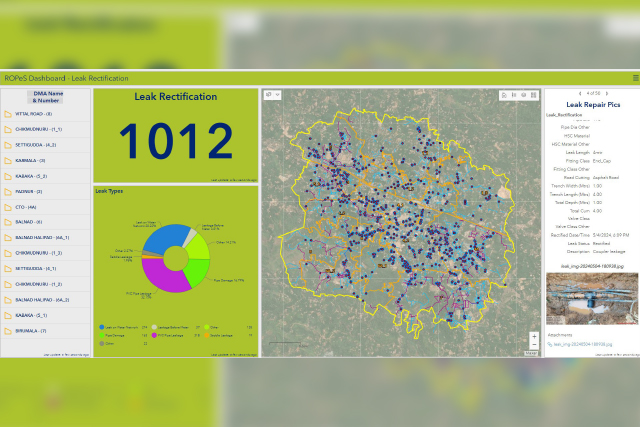
Suez Group has been active in the Indian water and wastewater market since 1978 and established an Indian subsidiary in 1986. Suez uses Esri products to enable comprehensive study and planning through GIS mapping, field surveys, and door-to-door surveys.