CUSTOMER SUCCESS STORY
GeoAI Gives APCRDA the Edge to Build Its Geospatial Foundation at Scale
The Challenge of Keeping Up with a Growing Capital Region
The Andhra Pradesh Capital Region Development Authority (APCRDA) spans around an area of 8352.69 Sq. Km, with an Urbanised area of ~650 Sq. Km under self-governing institutions of Urban Local Bodies (ULB) responsible for administering cities and towns. APCRDA oversees multiple projects on Regional Master Planning and Infrastructure development, including India’s most ambitious urban development projects — the greenfield capital city of Amaravati. At the scale of Regional Master Planning, accurate, up-to-date geospatial data isn’t a luxury. It’s the foundation every planning decision is built on. When you’re responsible for planning and developing an entirely new capital region from the ground up, the scale of work is immense.
One of the most time-intensive tasks in that process? Building footprint digitization. Traditionally, analysts would manually trace building outlines from aerial or drone imagery — a painstaking, labour-heavy process that struggled to keep pace with the speed of construction and urban growth on the ground.
APCRDA needed a smarter way.
Why GeoAI?
“ The GeoAI tools in ArcGIS gave us the ability to train a model that truly understands our region. We went from spending weeks on digitization to running inference in hours — and the accuracy is something we could not have achieved with a generic model. ”
— Dr. Preethi Latha T
Geospatial Team
Andhra Pradesh Capital Region Development Authority (APCRDA)
APCRDA ULBs’ drone imagery was captured at a very high resolution, and the building patterns here are distinct. Roof types, structural forms, settlement densities, and construction styles in this region have their own character. The ULB selected is Guntur Municipal Corporation (GMC) (https://guntur.cdma.ap.gov.in//). Training a custom model for building footprint extraction meant the AI could learn exactly those local characteristics, resulting in detections that were accurate, consistent, and directly applicable to APCRDA’s planning workflows without extensive correction overhead.
The Model: Why Mask R-CNN?
APCRDA chose Mask R-CNN — an instance segmentation model that goes beyond detecting a building to give you the exact pixel-level polygon boundary of each structure. Unlike a simple bounding box, these precise footprints are directly usable in GIS workflows for area calculation, spatial analysis, and change detection.
ArcGIS natively supports Mask R-CNN. Training it requires no external tools — the entire workflow runs within ArcGIS Pro’s Image Analyst and can be scaled up using ArcGIS Enterprise with ArcGIS Image Server for larger areas.
| Model at a Glance: Mask R-CNN is an instance segmentation architecture that produces individual polygon masks for each detected object — making it ideal for building footprint extraction where precise shapes matter more than bounding boxes. |
Model Training at a Glance
Here is a snapshot of the training effort that went into building APCRDA’s custom model — from sample collection to inference on unseen buildings.
| 1,900 Training samples collected from drone imagery | 0.83 hrs of training on 16 GB NVIDIA GPU | 27000+ Buildings accurately detected in unseen inference area |

How Did They Do It?
The deep learning workflow in ArcGIS follows three clear steps — and APCRDA executed each one using tools natively available in ArcGIS Pro Image Analyst.
1. Prepare Training Data : Using the Label Objects for Deep Learning pane in ArcGIS Pro, analysts labelled buildings in their drone imagery. Training data was exported in RCNN Masks format — which captures the exact pixel boundary of each building, the precise input Mask R-CNN needs to learn from.
2. Train the Model: The model was trained using the “Train Deep Learning Model” geoprocessing tool. It learned from local building patterns in the region — different roof types, structural shapes, and settlement densities unique to the region’s geography.
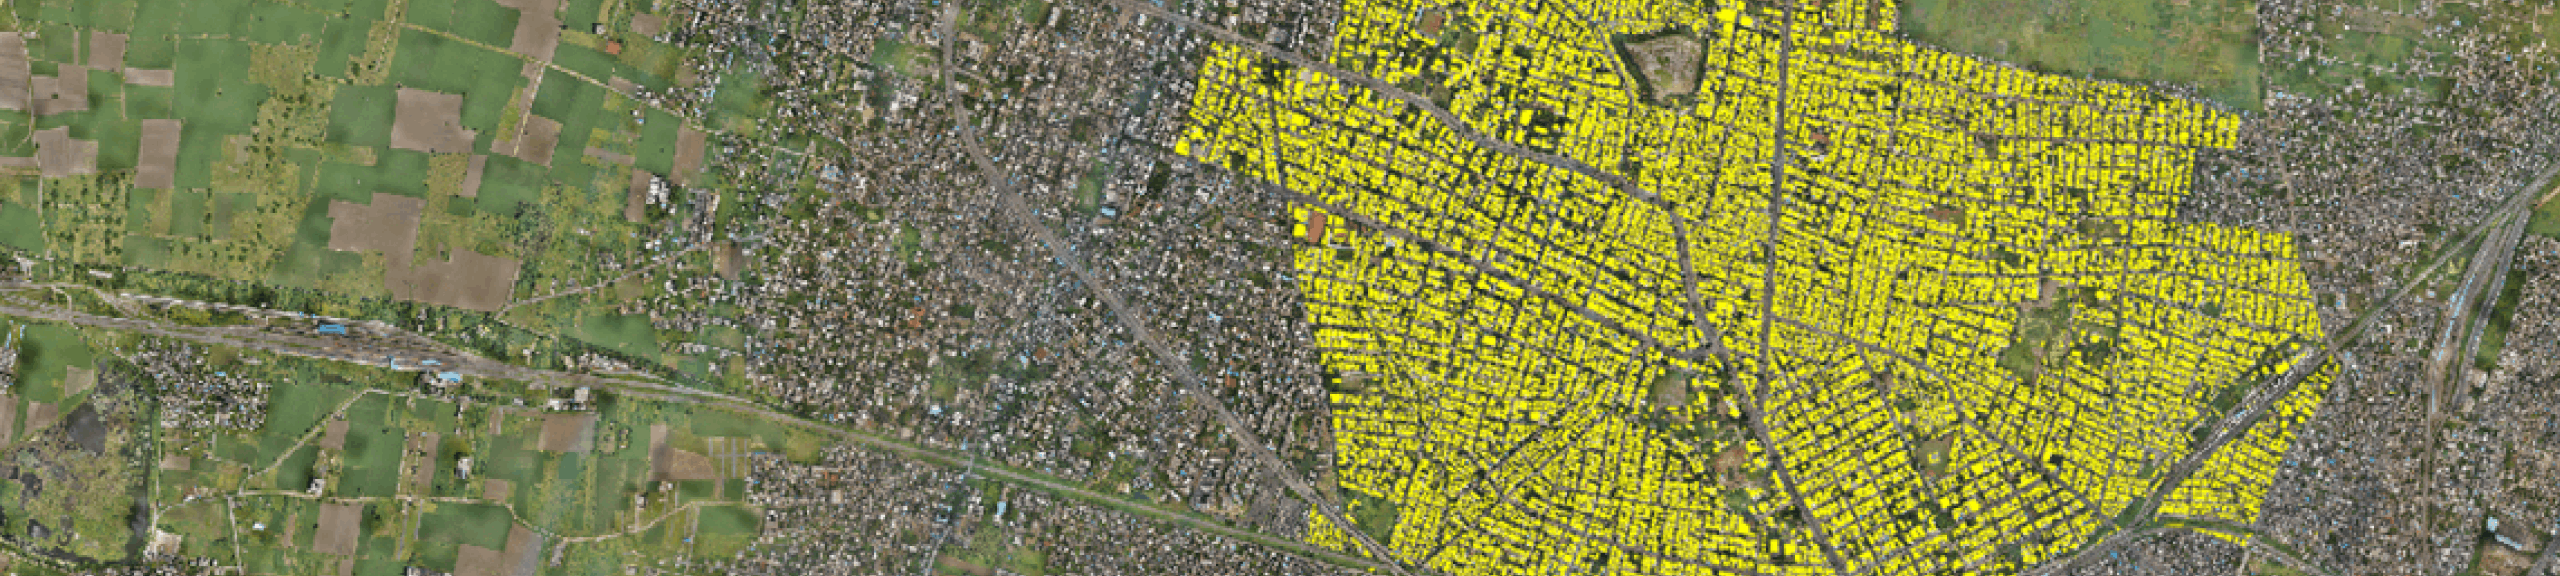
3. Run Inferencing: The trained model was applied to new drone captures using “Detect Objects Using Deep Learning.” The output: accurate building footprint polygons, ready for spatial analysis and integration into APCRDA’s planning workflows.
Tools like “Regularize Building Footprint” were used to refine irregular building polygons into straight-edged, aligned shapes.

The Impact
What once required teams of analysts spending days — sometimes weeks — on manual digitization can now be processed in a fraction of the time. Every new drone capture feeds directly into the model, producing updated footprints with minimal manual intervention.
| ↓ 80% Reduction in time spent on manual digitization | 0.83 Hours To process what previously took weeks of desk work | 100% Repeatable pipeline — runs on every new drone capture with minimal QA/QC |
Freed from repetitive tracing, skilled analysts at APCRDA can now focus on higher-value work — interpreting the data, validating results, and translating insights into planning decisions. For a development authority overseeing an actively growing city, this speed advantage is critical.
What Can They Do with This Data?
Building footprints are foundational to nearly every urban planning function. With a regularly updated, AI-generated footprint layer, APCRDA can now:
→ Monitor construction activity and urban growth over time using change detection
→ Estimate built-up area across different planning zones
→ Support property assessment, taxation, and land records management
→ Base layers for Master Plan preparation
→ Feed into flood risk modelling, utility network design, and infrastructure planning
→ Maintain a current building inventory that keeps pace with on-ground construction
APCRDA’s success is a practical blueprint for how government agencies and urban development authorities can turn one of geospatial work’s most stubborn bottlenecks into a streamlined, scalable pipeline.
ADDITIONAL RESOURCES
🙏 A Note of Thanks
We are grateful to the APCRDA geospatial team (Dr. Preethi Latha T, Y Lavanya and D Manasa) for their openness in sharing this experience and for trusting Esri India as their technology partner on this journey. Their willingness to explore, experiment, and push the boundaries of what GeoAI can do in the context of urban planning is truly inspiring. We look forward to continuing this collaboration as Amaravati grows.