
Cities Under Surveillance
ArcGIS-Driven Crime Mapping in Siliguri City, the “Gateway to Northeast India”
Subham Roy
Statement on data use: The crime data presented here is not publicly available due to ongoing research and confidentiality constraints. However, for spatial modelling using MGWR, several explanatory variables were sourced from open-access platforms, including Nightlight, built-up and land use data from USGS and NASA, socio demographic indicators from the Census of India (2011), and urban features such as road networks and public spaces digitized from Google Earth and OSM. These variables provide the spatial foundation for analysing the structural correlates of urban crime.

Figure 1. The maps depict property crime density of Siliguri City, India (2021-2023) and spatial clustering patterns using Kernel Density Estimation (KDE) and LISA statistics. High-density zones align with High-High clusters and Low-High outliers, while peripheral areas show Low Low clusters and other outlier patterns. The inset maps highlight three distinct spatial zones based on crime intensity and clustering characteristics, revealing clear spatial disparities in urban crime distribution.

Figure 2. Property Crime Hotspot and Coldspot Zones in Siliguri City Using Getis-Ord Gi* statistics (2021-2023). This map presents spatial clustering of property crimes based on Getis-Ord Gi* statistics, identifying statistically significant hotspots (red) and coldspots (blue) at varying confidence levels. The left panel uses interpolated Gi* output to highlight intensity gradients, while the inset circular panels delineate specific zones of concentrated hotspots and coldspots. High-confidence hotspots are centrally concentrated, whereas coldspots dominate peripheral and northern zones, indicating strong spatial disparities in crime intensity.

Figure 3. Spatio-Temporal Analysis of Emerging Property Crime Hotspots in Siliguri City (2021-2023). This map visualizes emerging patterns of property crime using space-time hotspot analysis based on Getis-Ord Gi* and Mann-Kendall trend statistics. The classification identifies zones as new, consecutive, intensifying, persistent, sporadic, and oscillating hotspots, capturing the dynamic temporal behaviour of crime intensity across the urban landscape. Insets highlight critical zones of hotspot emergence and transformation, offering insights into evolving spatial risk patterns relevant for predictive policing and urban safety planning.
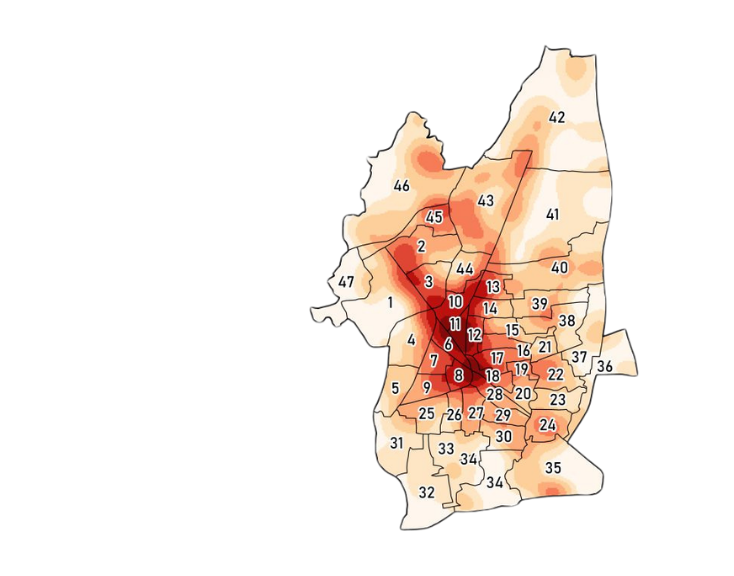
Model specification: Spatial variations of dependent (PROPERTY CRIME) and selected (14) explanatory variables across domains for identifying probable cause (through Multi-Scale Geographically Weighted Regression-MGWR) of crime in city.


MGWR- Multiscale Geographically Weighted Regression output showing influence of various (14) explanatory variables over the property crime in Siliguri City across different Wards.

MGWR output continued.
